dsh-chartlab
Run the following command in DeepSeek Harness:
dsh plugin install SMOKTEA/dsh-chartlab
Paste the following prompt into your AI chat to install this plugin:
Run dsh plugin install SMOKTEA/dsh-chartlab in your terminal to install the plugin; source is available at https://github.com/SMOKTEA/dsh-chartlab .
About this plugin
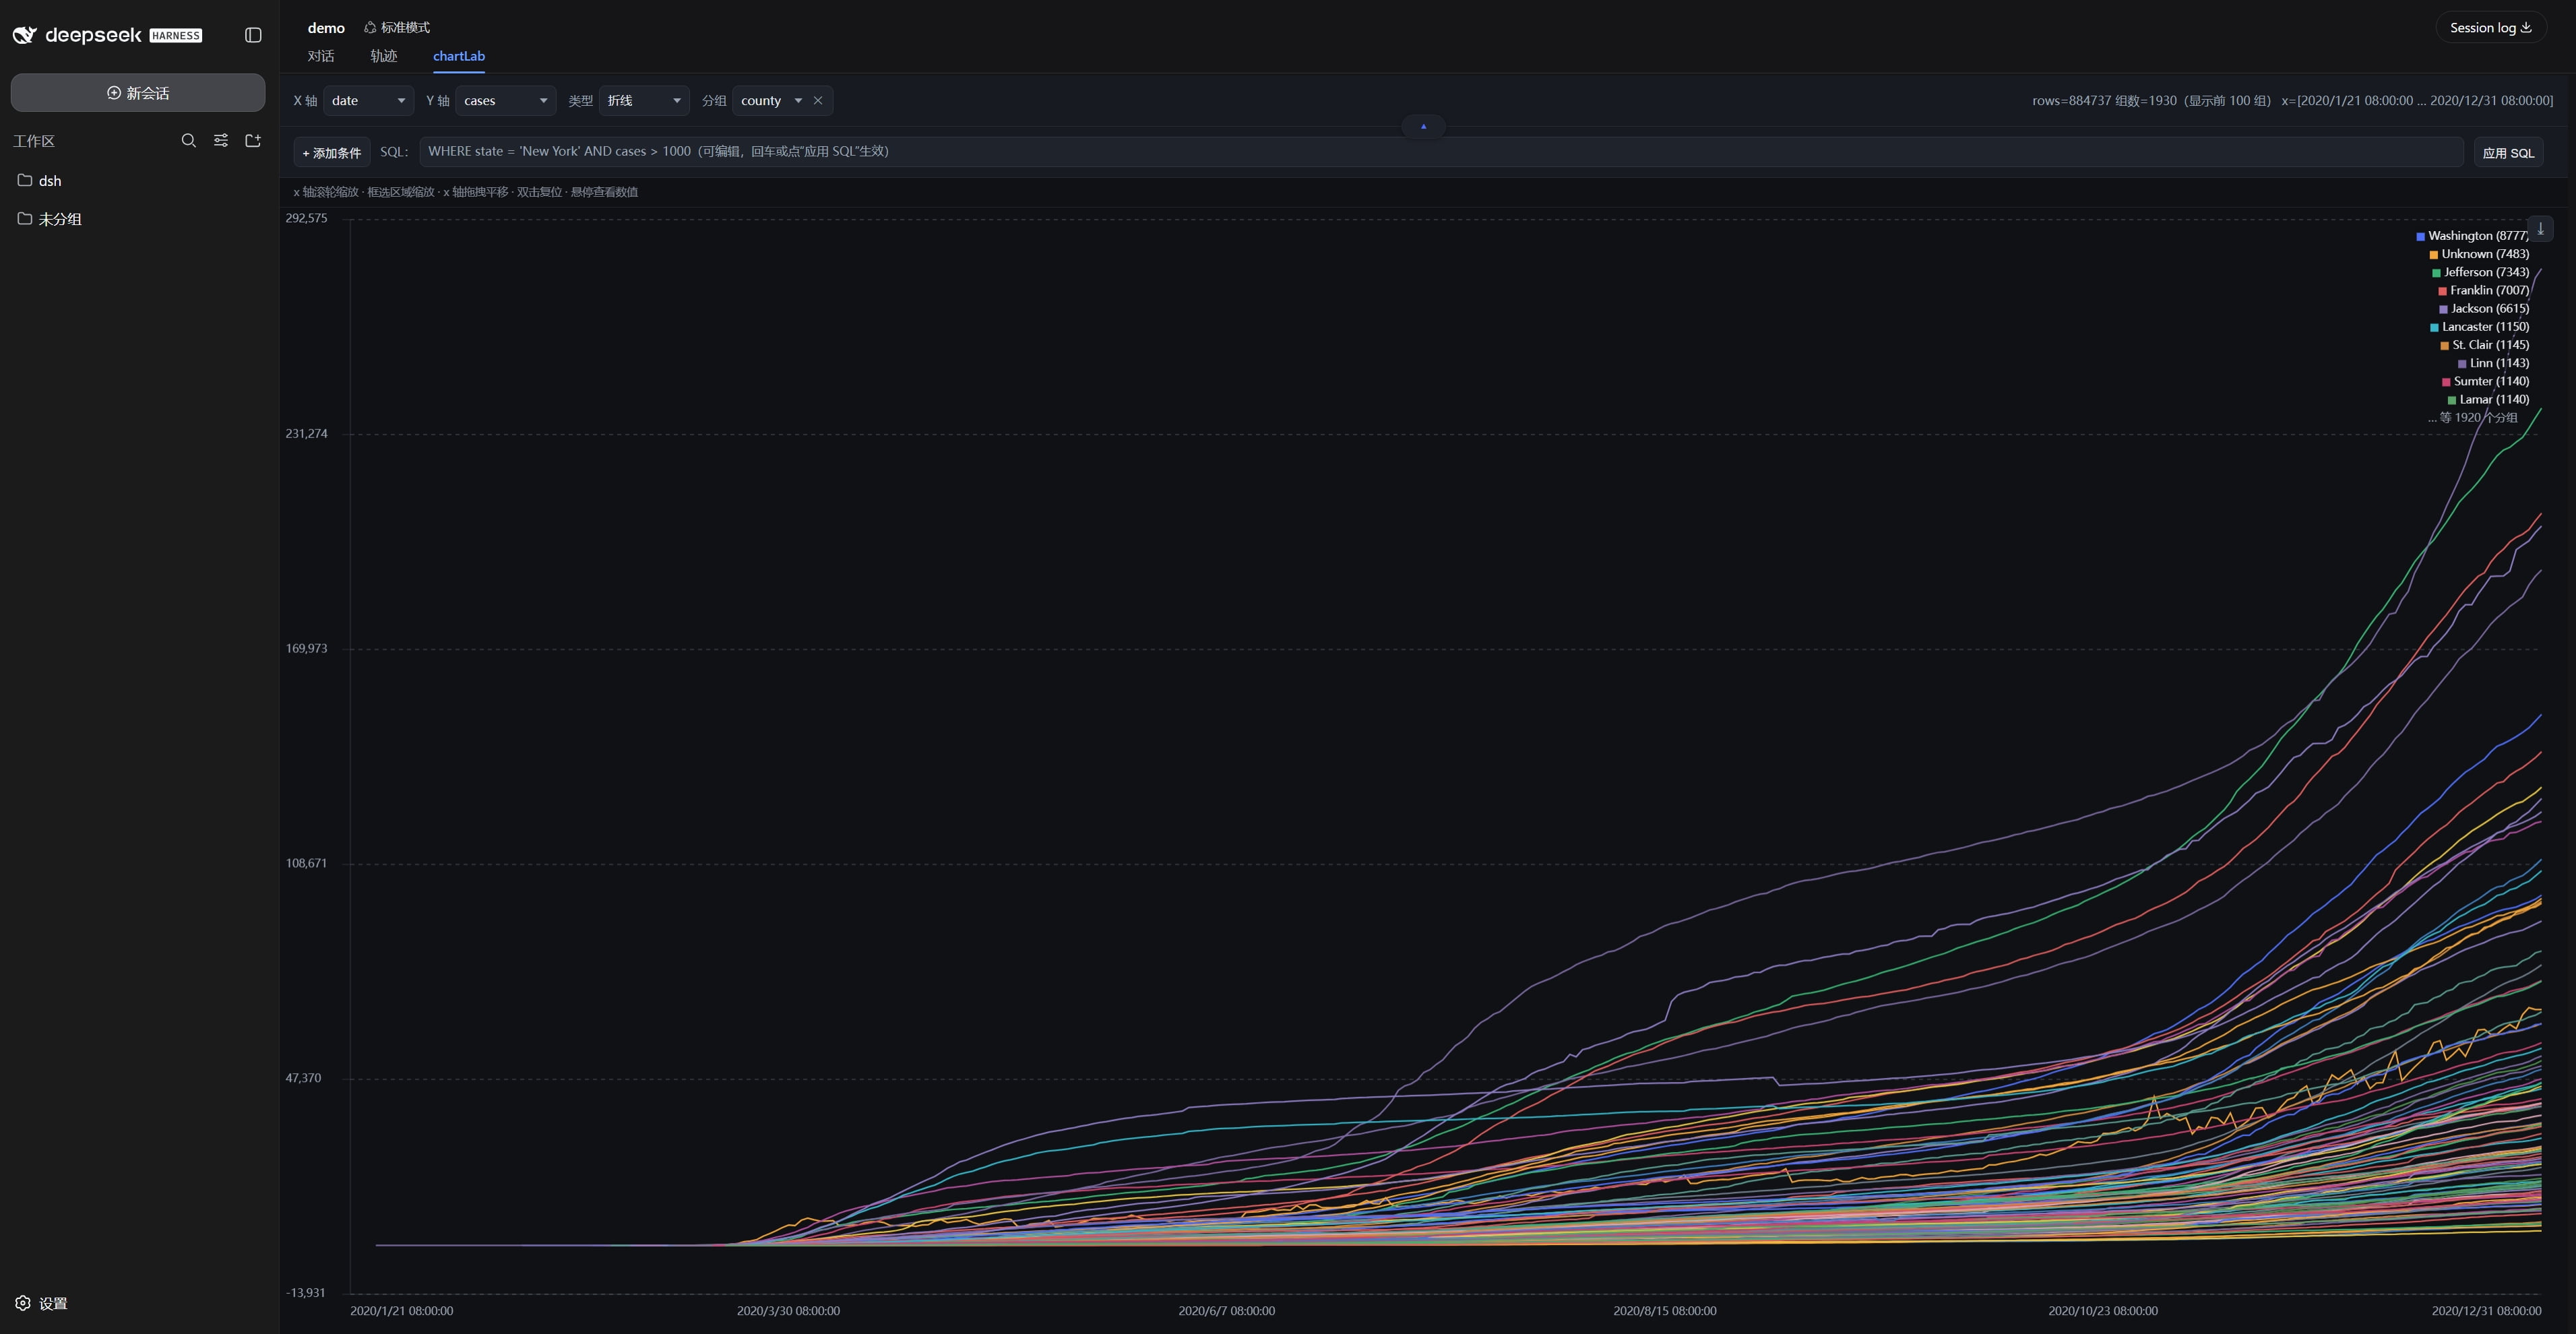
Your data sits in CSV, Excel, or DuckDB files, and glancing at a trend means opening a spreadsheet, pulling formulas, adjusting axes, setting filters. dsh-chartlab lets an Agent turn that data into an interactive chart with a single prompt, so you skip the window-switching ritual.
Line and scatter charts are supported; even with millions of rows, only the visible range is loaded, keeping zoom and pan smooth. Conditional filters cover equality, inequality, range, multi-select, and date ranges; grouping by a column draws one line per distinct value; and you can paste multi-line SQL directly on the chart page. Hover readout, box-select zoom, scroll-wheel zoom, and screenshot download are all built in, and the UI follows DSH theme and language automatically without a refresh.
Data analysts minding daily reports, developers doing lightweight DuckDB analysis, or anyone who wants to explore local data without leaving the chat window will find a handy chart workbench right here.
Screenshots
Use Cases
- Ask the Agent to render a scalable line chart from an Excel sales file
- Run SQL on a DuckDB table and visualize results right in chat
- Group and filter a million-row CSV by date range to spot trends
Best For
- Data analysts handling daily reports
- Developers doing lightweight DuckDB analysis
- Users who want to explore local data without leaving the chat window
Related Plugins
A unified suite combining hot runtime injection, task-aware thinking-mode routing, and a graded session protocol with red-team gates to sustain model diligence across long-horizon inference.
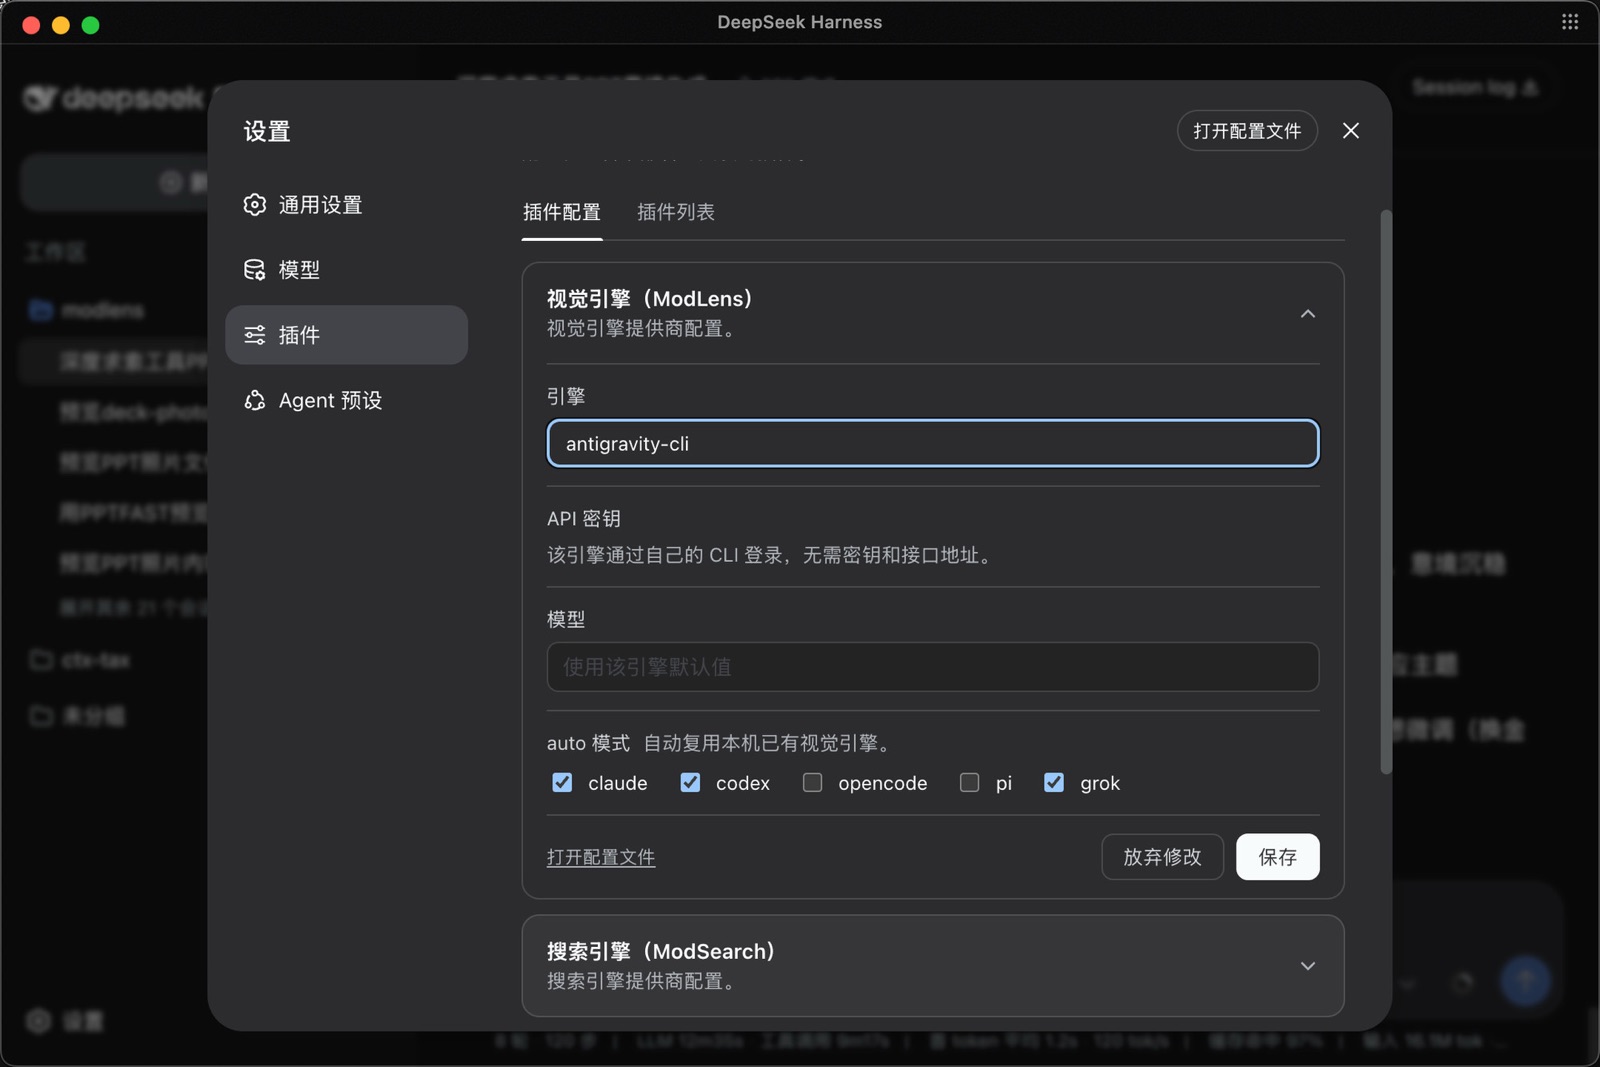
ModLens is a vision plugin for DeepSeek Harness that gives text-only models sight by reading images pasted directly into chat, with zero-config setup and multiple vision engines.
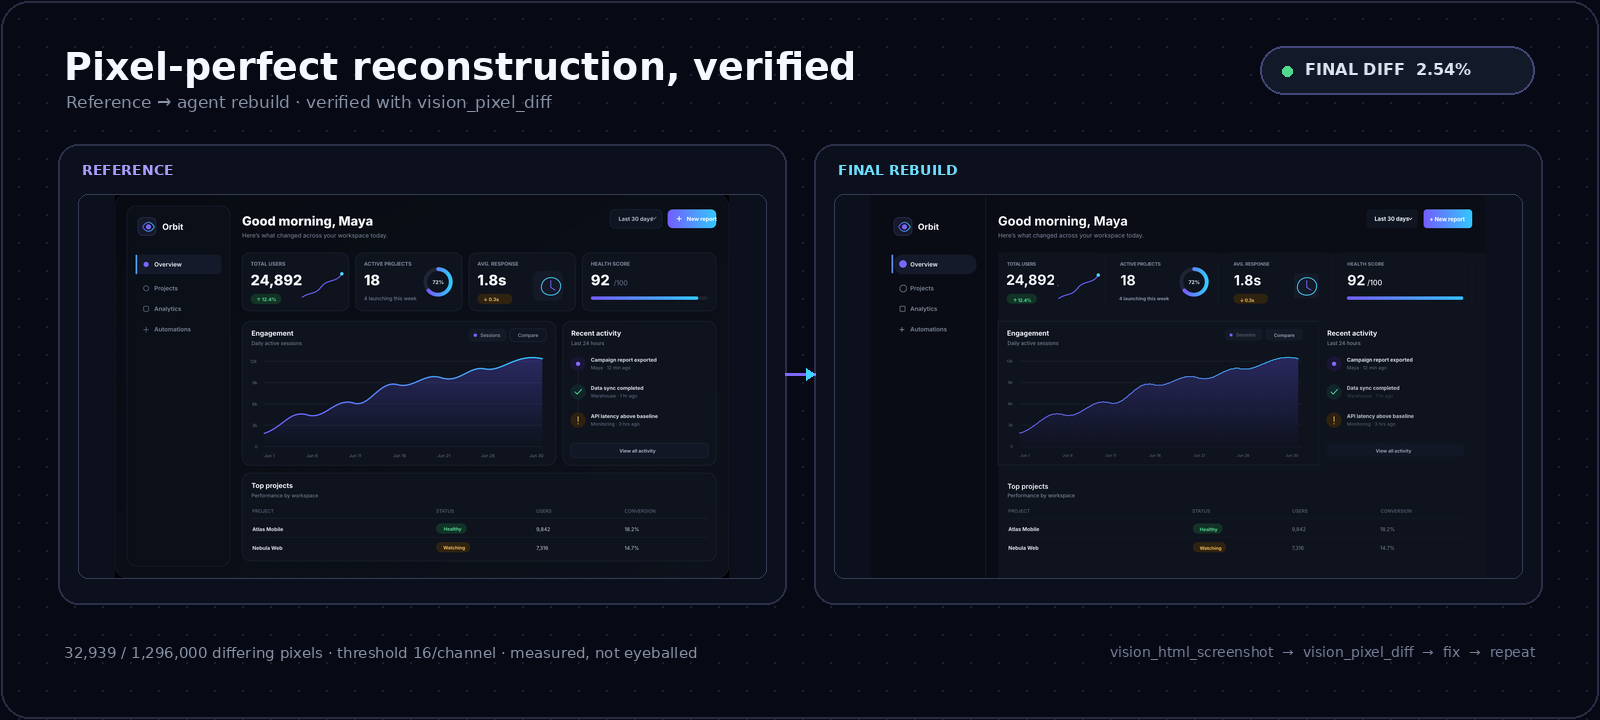
On-demand vision for text-only DeepSeek Harness agents: built-in free keyless vision chain and 14 vision tools, routing image turns as tool calls to vision models with pixel fidelity, no Python needed, one-command install.
Give text-only models in DeepSeek Harness eyes, enabling image Q&A, long-screenshot OCR, UI restoration, and GUI visual tasks.