dsh-otel
Run the following command in DeepSeek Harness:
dsh plugin install jwilson411/dsh-otel
Paste the following prompt into your AI chat to install this plugin:
Run dsh plugin install jwilson411/dsh-otel inside DeepSeek Harness to install; the source lives at https://github.com/jwilson411/dsh-otel, and you can enable it by setting exporter to stdout or otlp-http in cordis.patch.yml.
About this plugin
The DeepSeek Harness already writes a durable session log after every run, and Jaeger already knows how to draw a trace. What is missing is the translation, and that is all dsh-otel does: it reads the log, splits it into one span per turn, per step, and per tool call, links them into a single trace, and ships the result to any OTLP/HTTP collector you already run — or writes it straight to stdout. It does not observe the harness at runtime, buffer, or sample. A span carries only names, ids, timings, and the token counts the log itself reported; no prompt text, tool arguments, or tool results ever leave the process.
Every id is derived from a sha256 of the bracket's own coordinates, so exporting the same log twice produces the identical tree. If the collector was down the first time, re-running the export repairs the gap rather than duplicating it. Malformed lines are counted and skipped, unclosed brackets are stamped dsh.span.unclosed instead of dropped, and a step with no turn above it gets a synthetic parent so the tree never dangles. The OTLP/JSON document is written by hand with zero OpenTelemetry SDK as a runtime dependency, and the CLI runs against a bare checkout with nothing installed.
It is made for ML engineers and DevOps teams who already operate Jaeger, Phoenix, or Grafana Tempo: point the exporter at their existing stack and every harness run shows up in the trace view they already use. And when the harness itself is the thing that is broken, the CLI's dependency-free design makes it the lightest way to pull that run's structural timeline out for inspection.
Use Cases
- Split every harness run into per-turn, per-step, and per-tool spans and push them into an existing Jaeger or Grafana Tempo for a full call-chain view
- Use the zero-dependency CLI to export a session log as an OTLP document and rescue the structural timeline when the harness itself is broken
- Fold token usage and timing data into an existing OTLP collection pipeline and compare side-by-side with application traces
Best For
- ML engineers already operating Jaeger, Phoenix, or Grafana Tempo
- DevOps teams who want LLM inference trace data without pulling in an OpenTelemetry SDK
- Engineers debugging a broken harness who need one run's full structural timeline fast
Related Plugins
A unified suite combining hot runtime injection, task-aware thinking-mode routing, and a graded session protocol with red-team gates to sustain model diligence across long-horizon inference.
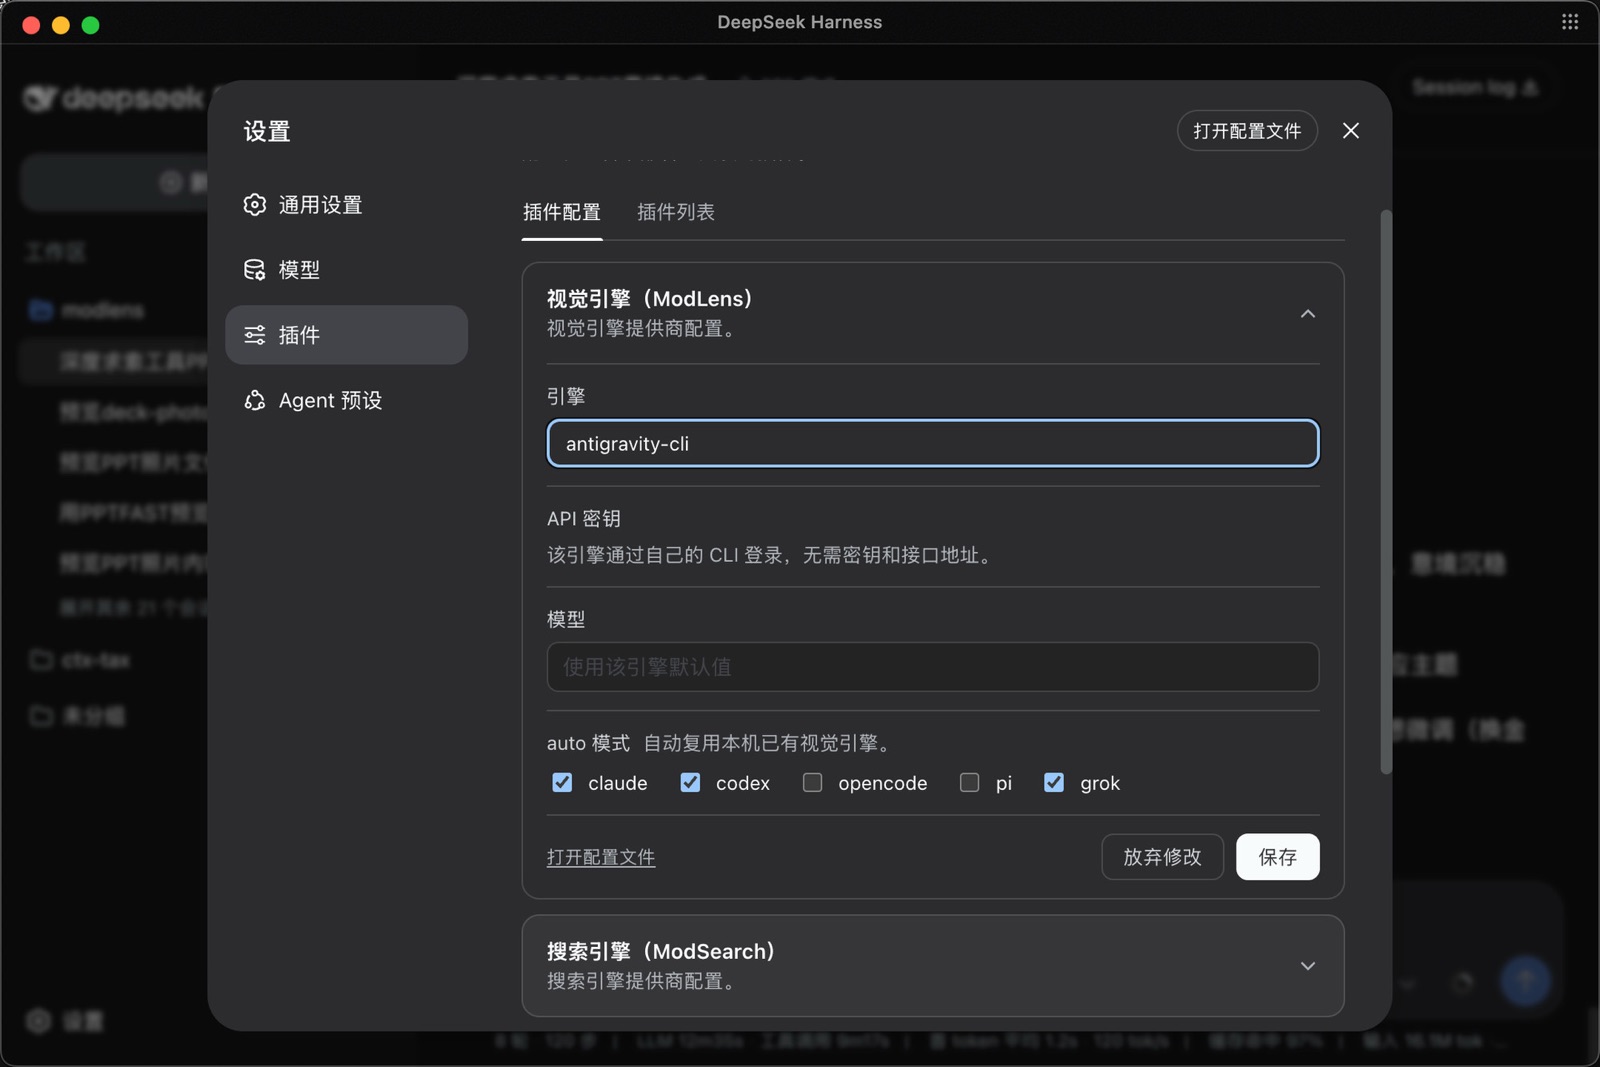
ModLens is a vision plugin for DeepSeek Harness that gives text-only models sight by reading images pasted directly into chat, with zero-config setup and multiple vision engines.
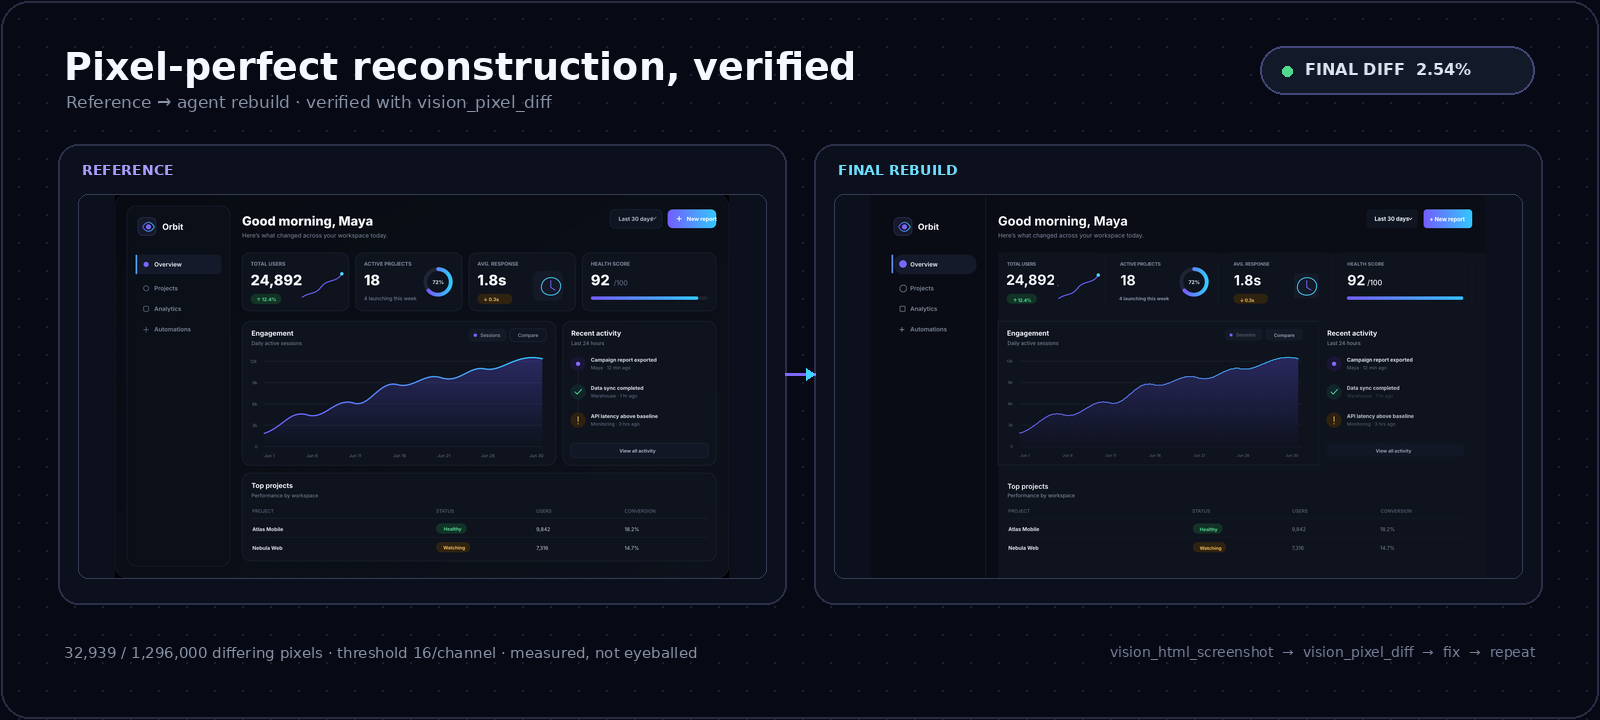
On-demand vision for text-only DeepSeek Harness agents: built-in free keyless vision chain and 14 vision tools, routing image turns as tool calls to vision models with pixel fidelity, no Python needed, one-command install.

Give text-only models in DeepSeek Harness eyes, enabling image Q&A, long-screenshot OCR, UI restoration, and GUI visual tasks.