
dsh-token-stats
Run the following command in DeepSeek Harness:
dsh plugin install Yinxe/dsh-token-stats
Paste the following prompt into your AI chat to install this plugin:
Run dsh plugin install Yinxe/dsh-token-stats in the DeepSeek Harness terminal to install this plugin (source: https://github.com/Yinxe/dsh-token-stats); restart DSH after installation to activate.
About this plugin
Every conversation in DeepSeek Harness consumes input, output, and cache-read/write tokens, yet those numbers are scattered across individual session logs. Answering simple questions like how much you have used in total, which models dominate, and which days were heaviest used to mean digging through raw records. dsh-token-stats aggregates token usage from all local sessions into a single live dashboard, making your consumption instantly legible.\n\nFrom the settings page you get a cumulative overview (input / output / cache breakdown), peak single-request and peak daily figures, streak tracking, and call-count statistics. Daily and weekly trend curves, a 24-hour distribution histogram, and a GitHub-style yearly activity heatmap reveal your usage rhythms. A donut chart with per-model details shows share, call count, and token split for every model. A persistent Today widget at the bottom of the sidebar gives hour-by-hour model stacking with a day-over-day comparison, and it can be detached into a draggable floating window so the sidebar stays uncluttered.\n\nAll figures are computed in real time by scanning local session logs, with no separate persistence layer and no data leaving your machine. Duplicate counting from forked, resumed, or sub-agent sessions is handled transparently. Animations respect the system reduce-motion preference and play only on first open; incremental updates land silently. Ideal for developers who call DeepSeek heavily, teams that need periodic token-cost reporting, and the simply curious who want to see how many tokens a single day burns.
Screenshots


Use Cases
- Review token consumption trends and daily peaks over 7/30/90 days
- Compare token share, call counts, and input/output splits across models
- Recall daily usage rhythm with the yearly activity heatmap
- Check hour-by-hour today usage and day-over-day delta from the sidebar
Best For
- Developers who call the DeepSeek API heavily
- Teams that need periodic token-cost reporting
- Individual users curious about their daily token consumption
Related Plugins

Memory layer for coding agents that indexes local session history and auto-recalls relevant context before edits, commands, and failures, with no manual search needed.
Traceable, searchable cross-session memory for AI agents that turns conversation knowledge into a typed knowledge graph and recalls relevant subgraphs instead of replaying full history, natively integrated with DeepSeek Harness.
Gives DSH AI cross-session long-term memory, to-do and skill management, plus multi-session orchestration, external AI delegation, and an infinite canvas that grows with you.
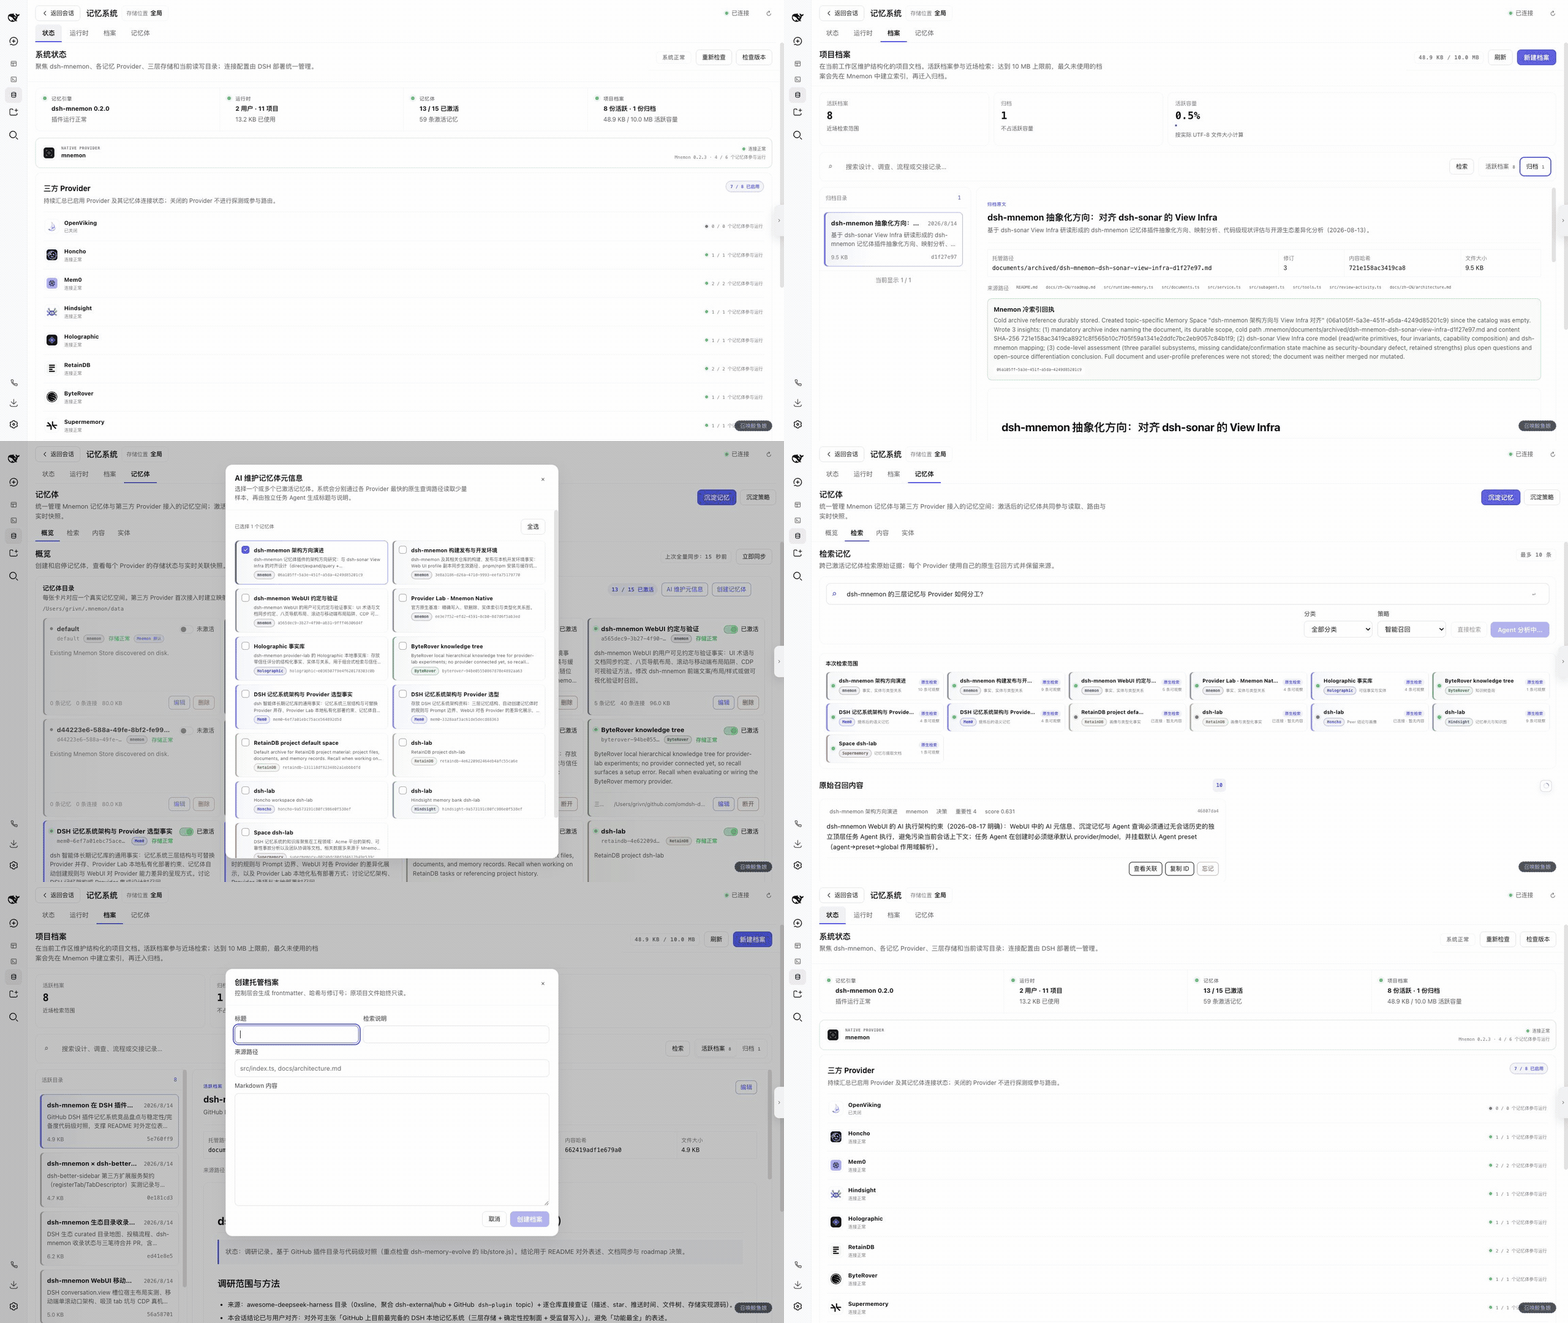
dsh-mnemon is a three-tier, pluggable, Agent-driven memory system for DeepSeek Harness, combining Runtime memory, Project Documents, and replaceable Memory Spaces with nine long-term providers.