dsh-token-speed
Run the following command in DeepSeek Harness:
dsh plugin install gbeta/dsh-token-speed
Paste the following prompt into your AI chat to install this plugin:
Run dsh plugin install gbeta/dsh-token-speed in your DeepSeek Harness terminal to install this plugin; the source repository is available at https://github.com/gbeta/dsh-token-speed
About this plugin
When you are deep into a long-context run in the DSH client, it is easy to lose track of how fast the model is actually emitting tokens. Is this turn cruising at 120 tok/s or grinding along at 40? What was the real TTFT? Answering those questions should not require grepping through logs or spinning up a side script.
dsh-token-speed turns those answers into a small draggable dial that lives in the bottom-right corner of the Web GUI. While the model is streaming, the needle and the centre number climb in real time, estimated from the accumulated text length multiplied by a live characters-per-token ratio. At each step boundary the plugin reads the provider usage.outputTokens together with the firstToken-to-completed timestamps to compute an exact tok/s figure, then feeds that reading back to refine the ratio for the next round. A single click on the dial unfolds a detail panel: live estimated speed, the previous step's precise tok/s, its output token count, its TTFT, and the cumulative output within the current loaded window. The dial also colours the current state — generating, tool executing, or idle — and remembers wherever you drag it via localStorage. Everything is a pure read-only browser subscription; no host state is mutated.
If you use the DSH desktop or Web client day-to-day for inference, prompt iteration, or side-by-side model comparisons and you want a glanceable signal on throughput and latency without leaving the chat, this is a lightweight dial that pulls those numbers out of the logs and onto your screen.
Screenshots
Use Cases
- Monitor tok/s and TTFT in real time during long-context runs to spot stalls or dropped tokens at a glance
- Read throughput, first-token delay, and cumulative output in one panel when comparing models or tuning prompts
- Use the dial colour to tell generation apart from tool execution so idle waits are not confused with slow tokens
Best For
- Developers who run inference daily in the DSH desktop or Web client and want throughput and latency always in view
- Prompt engineers and model evaluators who need quantified tok/s and TTFT numbers without leaving the chat
- Users who prefer lightweight GUI add-ons over modifying host state or standing up extra backend services
Related Plugins
A unified suite combining hot runtime injection, task-aware thinking-mode routing, and a graded session protocol with red-team gates to sustain model diligence across long-horizon inference.
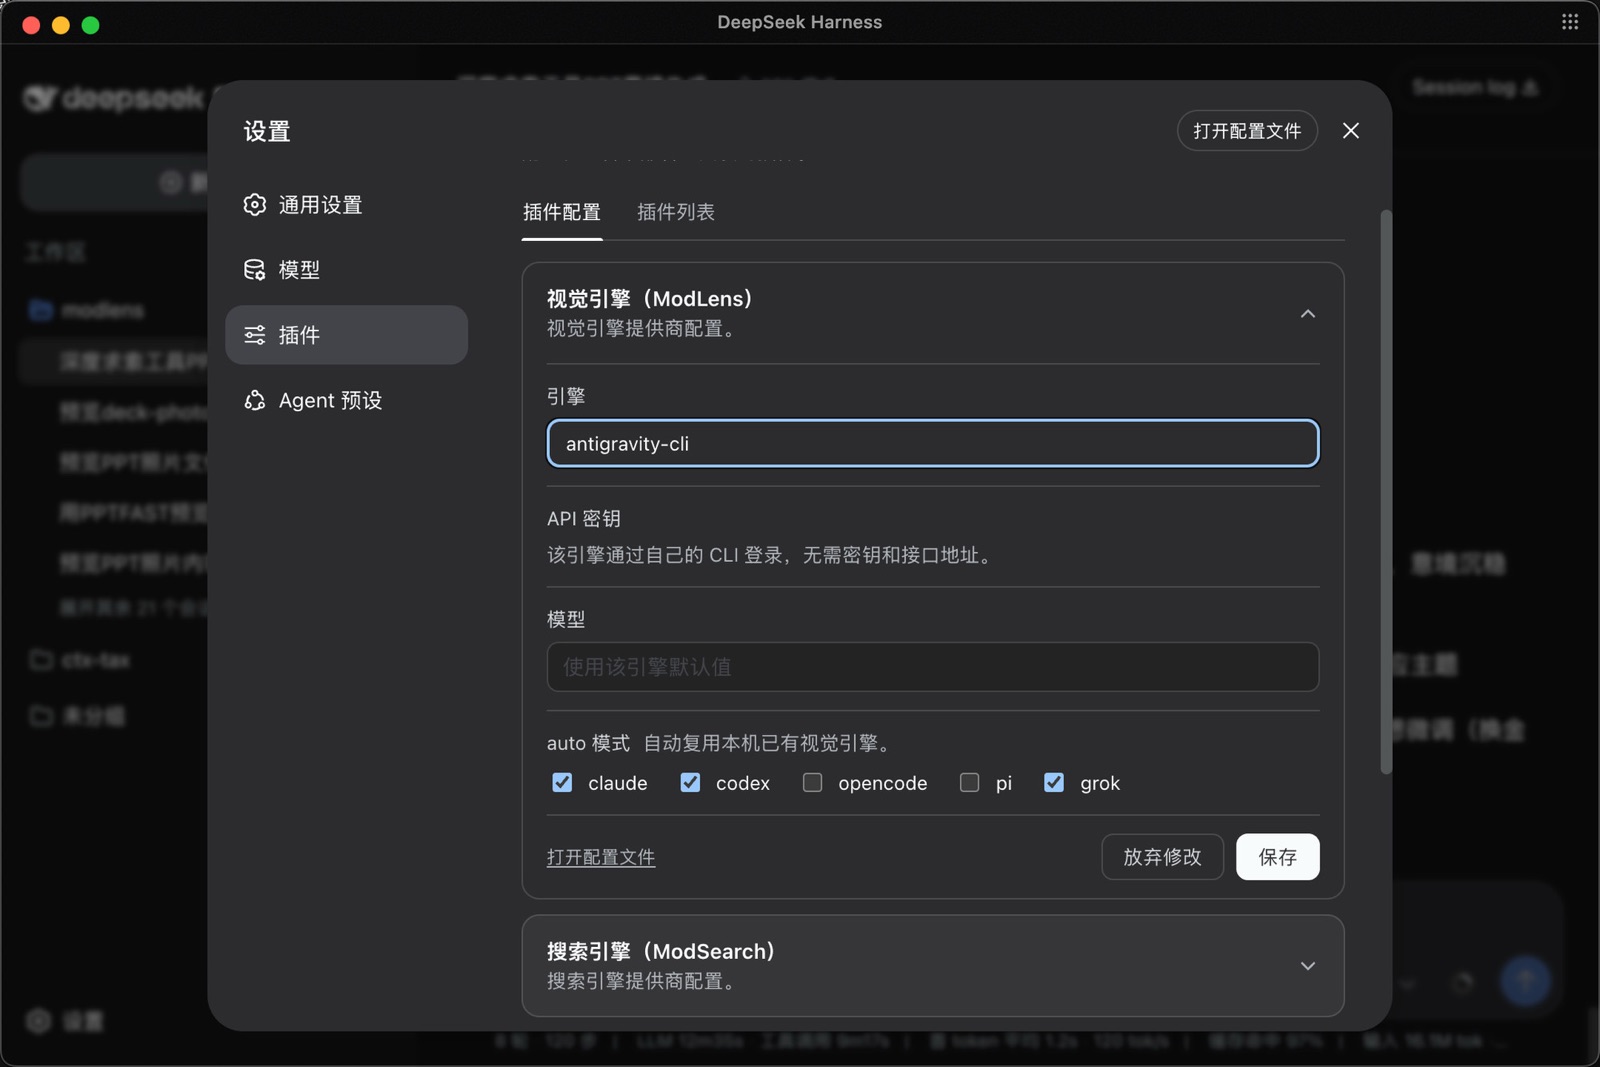
ModLens is a vision plugin for DeepSeek Harness that gives text-only models sight by reading images pasted directly into chat, with zero-config setup and multiple vision engines.
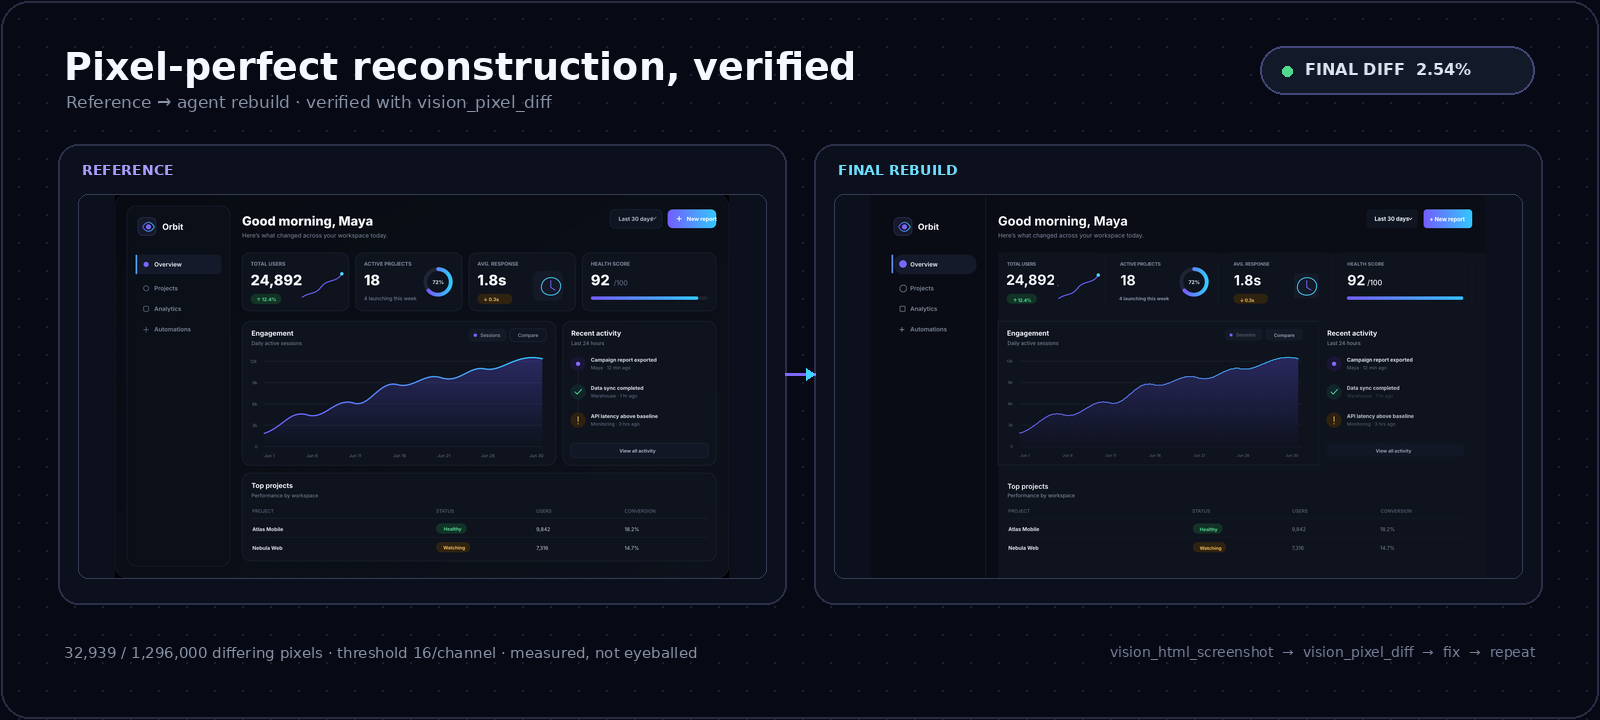
On-demand vision for text-only DeepSeek Harness agents: built-in free keyless vision chain and 14 vision tools, routing image turns as tool calls to vision models with pixel fidelity, no Python needed, one-command install.

Give text-only models in DeepSeek Harness eyes, enabling image Q&A, long-screenshot OCR, UI restoration, and GUI visual tasks.