dsh-function-plot
Run the following command in DeepSeek Harness:
dsh plugin install kirineko/dsh-function-plot
Paste the following prompt into your AI chat to install this plugin:
Run dsh plugin install kirineko/dsh-function-plot inside DeepSeek Harness to install this plugin; the full source is available at https://github.com/kirineko/dsh-function-plot . Once installed, you can plot functions and render workspace SVGs directly in the conversation.
About this plugin
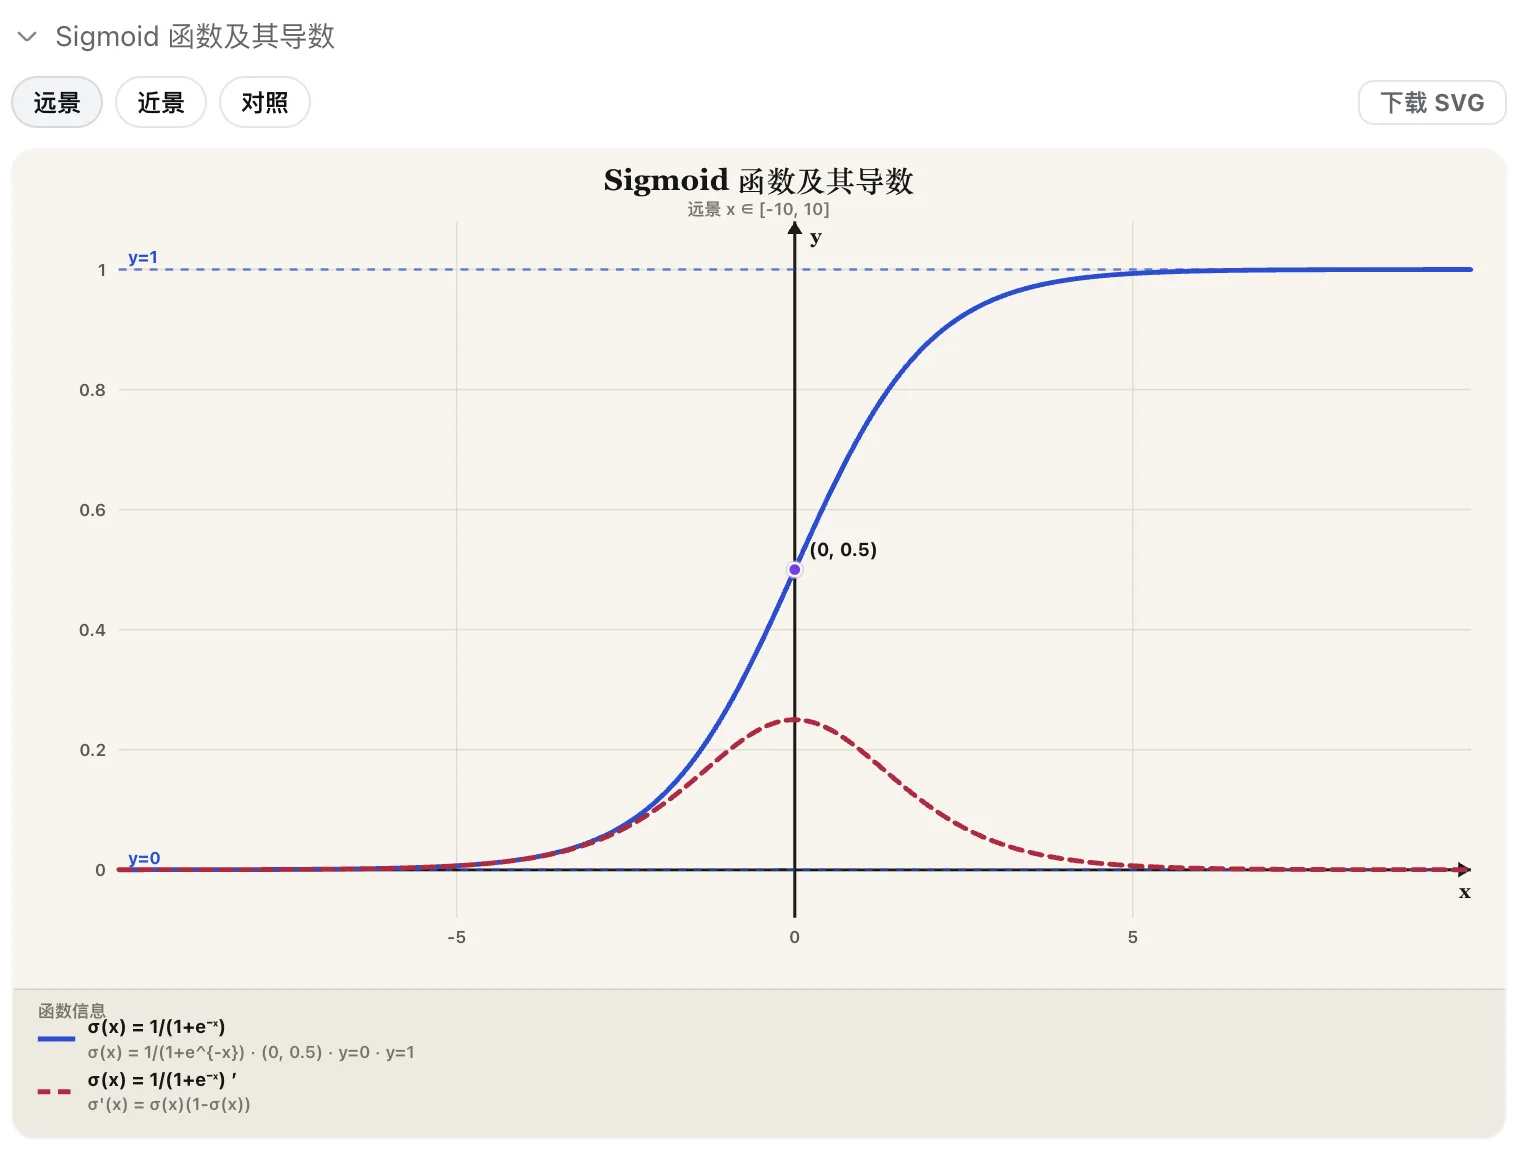
When discussing functions like sigmoid, GELU, or a probability distribution in a conversation, no amount of precise text matches the clarity of a visual. dsh-function-plot brings interactive function plotting directly into DeepSeek Harness dialogs, so a single natural-language prompt is all it takes to generate a function card—no need to open an external plotting tool or copy-paste results.
It works along two tracks. First, plotting functions: activation functions (sigmoid, ReLU, GELU), probability distributions, and arbitrary y = f(x) expressions are all supported. The resulting card offers zoom-out, zoom-in, and side-by-side comparison views, displays function parameter details, and lets you download the result as an SVG file. Second, displaying existing SVGs: any .svg file already in your workspace can be rendered directly into a dialog card without going through the plotting pipeline. Both modes write output to the .dsh-plots/ directory, producing standalone cards in standard mode or nested cards under run_code in PTC mode.
It is well suited to scenarios where function visualization comes up frequently in conversation: illustrating activation curves during an ML lesson, quickly checking the shape of a function during research, or dropping an existing SVG chart into a discussion thread. It works out of the box with no extra configuration required.
Screenshots
Use Cases
- Comparing activation function curves on the fly during a lesson
- Quickly checking the shape of a distribution or arbitrary y=f(x)
- Dropping an existing workspace SVG into the conversation thread
Best For
- Researchers who need function visualization frequently in dialog
- ML instructors who compare curves live in class
- Daily Harness users who want fewer tool switches
Related Plugins
A unified suite combining hot runtime injection, task-aware thinking-mode routing, and a graded session protocol with red-team gates to sustain model diligence across long-horizon inference.
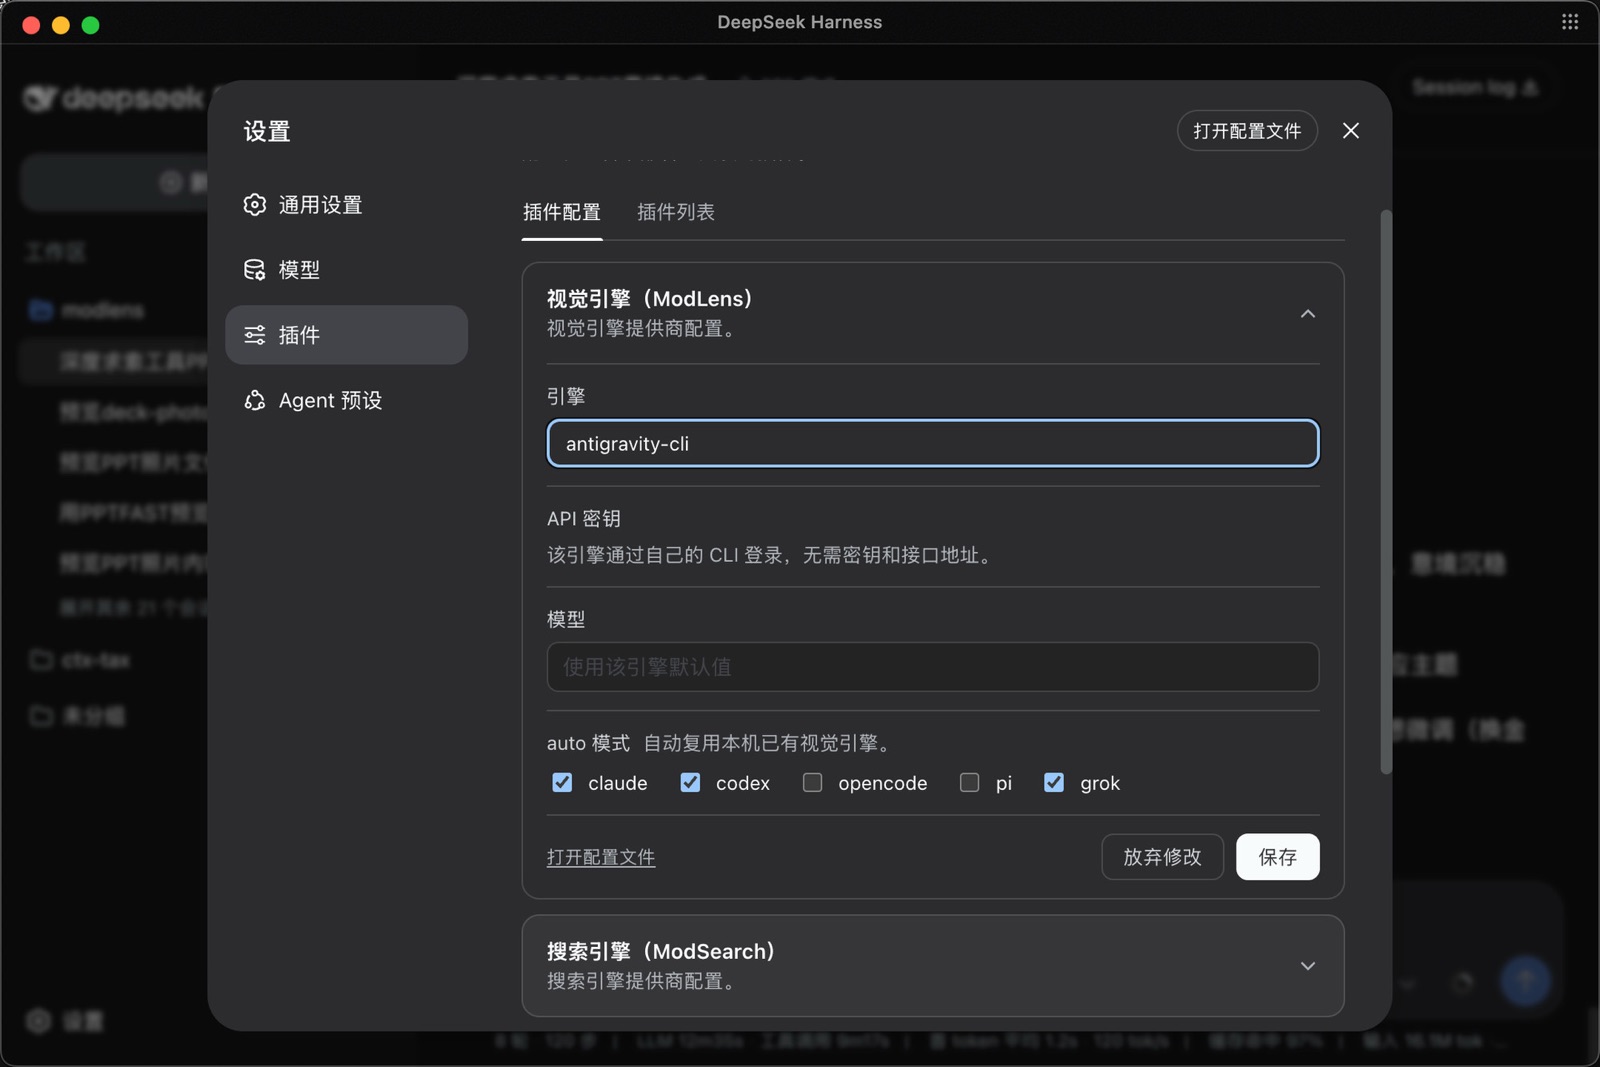
ModLens is a vision plugin for DeepSeek Harness that gives text-only models sight by reading images pasted directly into chat, with zero-config setup and multiple vision engines.
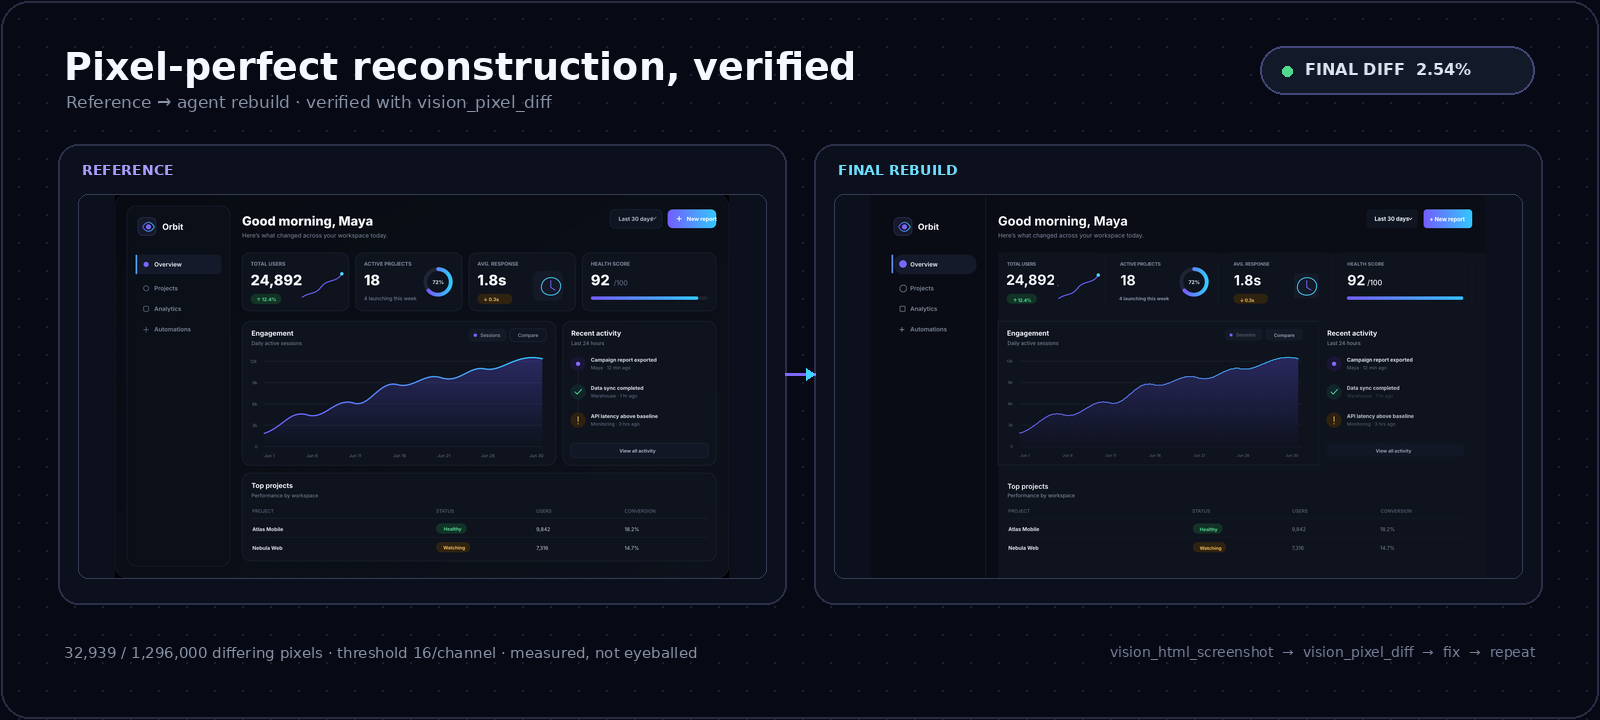
On-demand vision for text-only DeepSeek Harness agents: built-in free keyless vision chain and 14 vision tools, routing image turns as tool calls to vision models with pixel fidelity, no Python needed, one-command install.

Give text-only models in DeepSeek Harness eyes, enabling image Q&A, long-screenshot OCR, UI restoration, and GUI visual tasks.