dsh-antv-ava
Run the following command in DeepSeek Harness:
dsh plugin install HellowVirgil/dsh-antv-ava
Paste the following prompt into your AI chat to install this plugin:
Open a terminal inside DeepSeek Harness and run dsh plugin install HellowVirgil/dsh-antv-ava to install the plugin; the full source code and documentation are available at https://github.com/HellowVirgil/dsh-antv-ava.
About this plugin
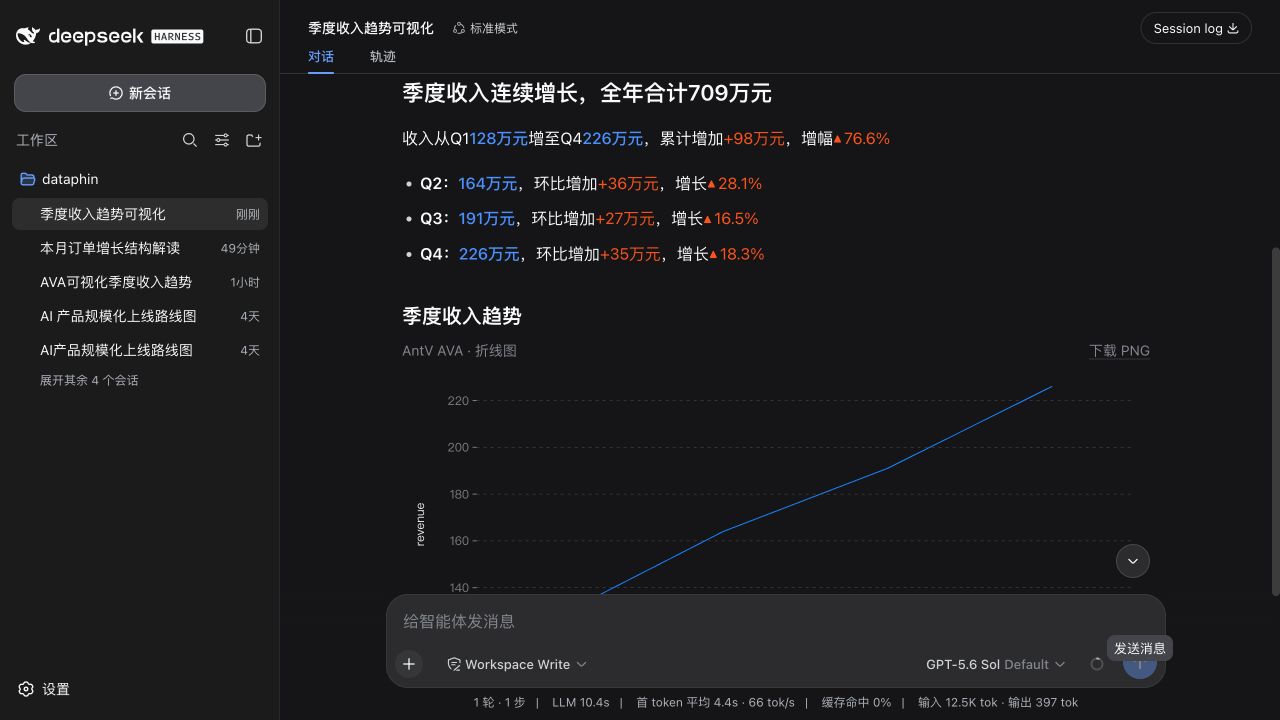
When you ask a model about KPI shifts, trends, or category shares, the reply is often a wall of numbers or an isolated chart with no narrative context. dsh-antv-ava lets the model decide whether to tell, show, or do both: narrative text streams phrase by phrase while AntV charts mount the moment usable data rows arrive and keep updating through generation. Both live inside a single conversation bubble instead of splitting into separate cards. The plugin adds semantic data expression—highlighted metrics, direction arrows, absolute changes, rates, contributions, inline proportion micro-charts—and inherits DSH typography and spacing, with chart axes, labels, and grid lines adapting in real time when you switch light or dark themes.
After generation completes, the AVA module scans the stable tabular result and surfaces significant trends, outliers, shifts, shares, and correlations, extending interpretation beyond the model single pass. The GPT-Vis chart engine loads lazily only when an answer contains a chart, and the parsing layer enforces source-size limits while blocking executable markup, dangerous URLs, and private-network resources.
Ideal for analysts, product managers, and anyone who needs model data output to be readable, visual, and trustworthy: business analysis, trend interpretation, rankings, comparisons, and composition breakdowns. It never invents values for visualization and never executes arbitrary HTML, SVG, or scripts emitted by the model.
Screenshots
Use Cases
- Asking the model about KPI trends, category shares, and period-over-period shifts
- Keeping charts and narrative blended inside one conversation bubble
- Adapting chart axes and labels in real time when toggling light or dark themes
Best For
- Data analysts and business operations teams
- Product and growth teams
- Developers who need trustworthy data presentation
Related Plugins
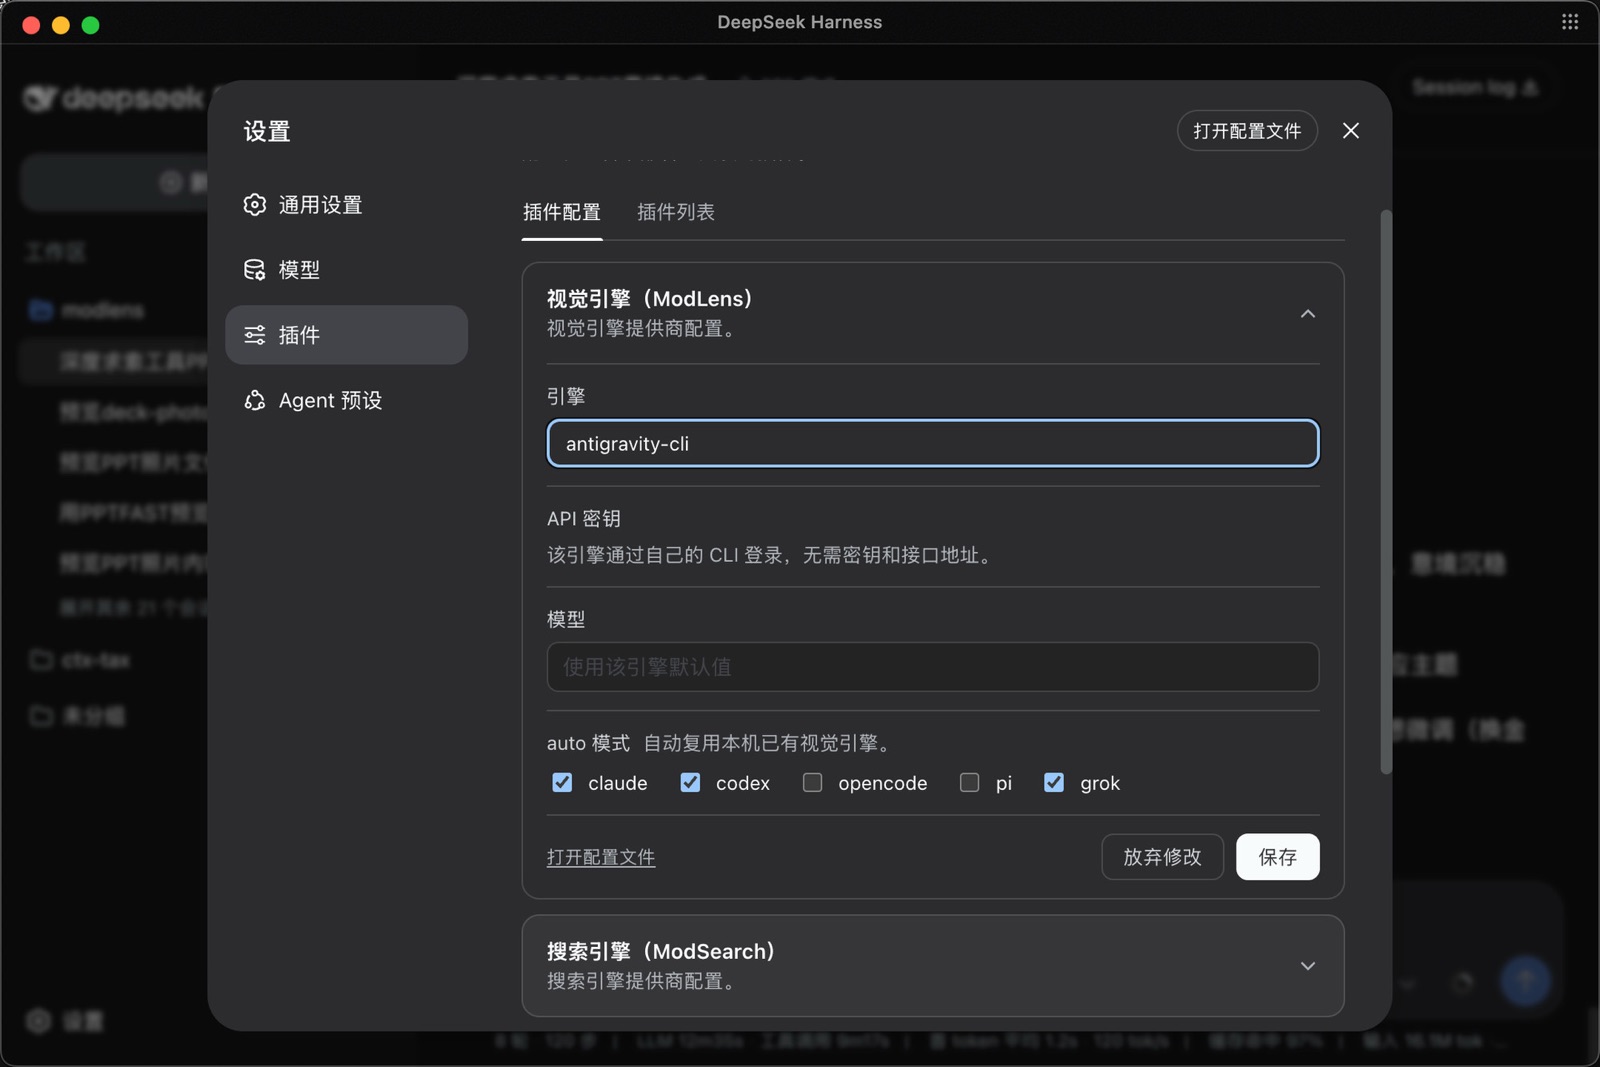
ModLens is a vision plugin for DeepSeek Harness that gives text-only models sight by reading images pasted directly into chat, with zero-config setup and multiple vision engines.
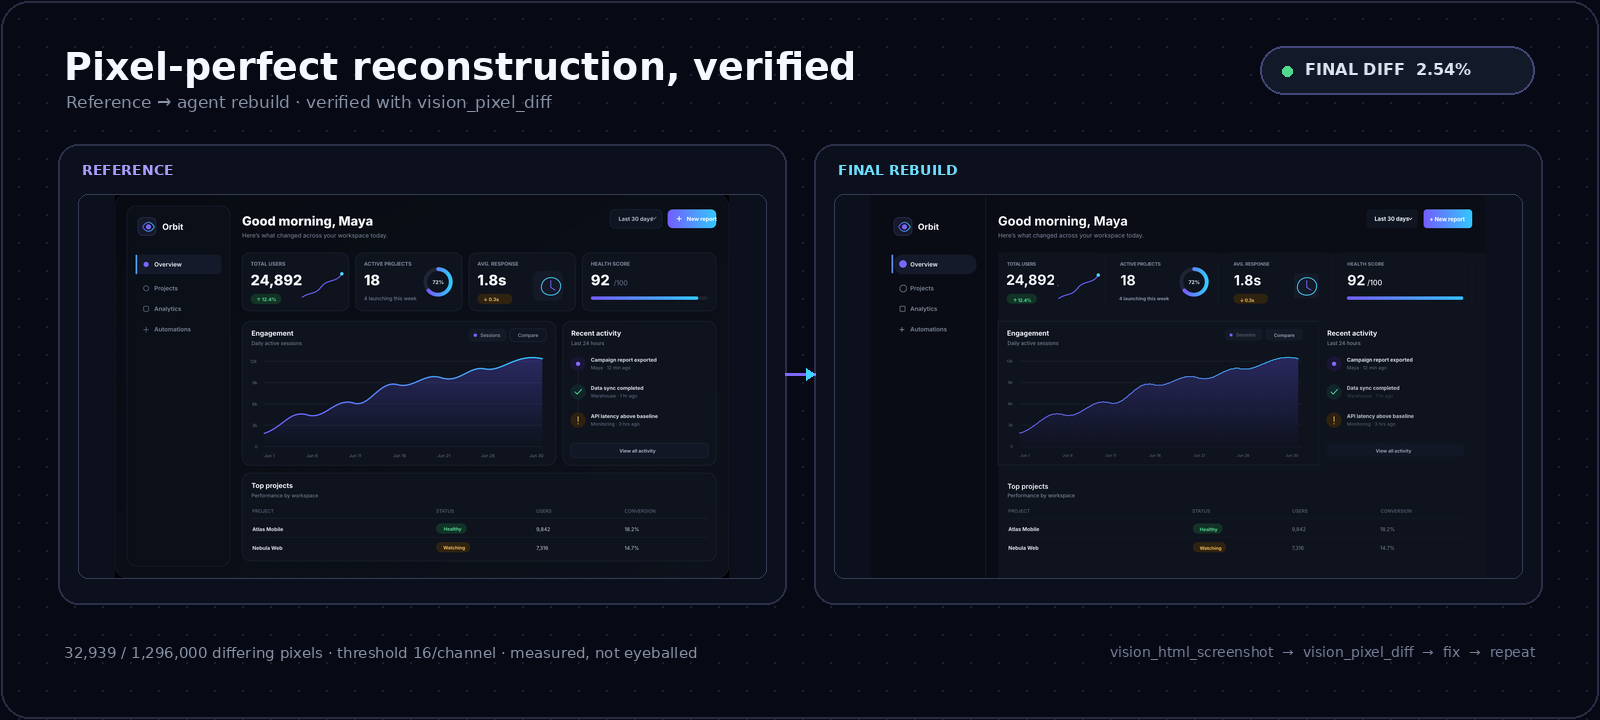
On-demand vision for text-only DeepSeek Harness agents: built-in free keyless vision chain and 14 vision tools, routing image turns as tool calls to vision models with pixel fidelity, no Python needed, one-command install.
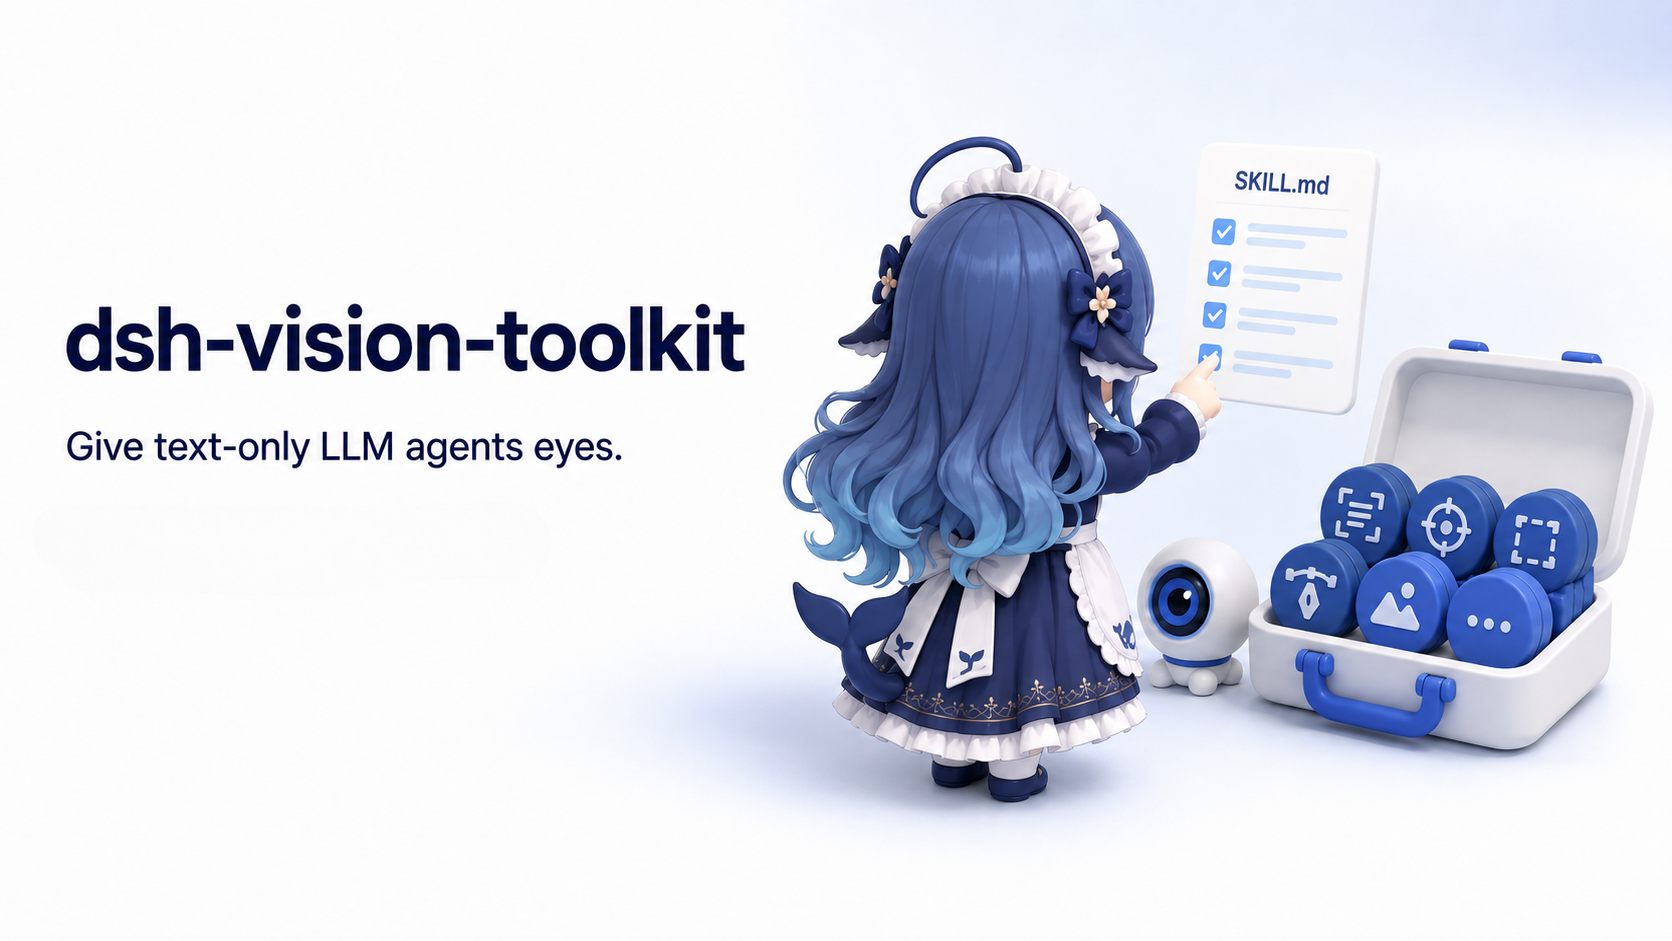
Give text-only models in DeepSeek Harness eyes, enabling image Q&A, long-screenshot OCR, UI restoration, and GUI visual tasks.
An armor-breaking plugin for DeepSeek: rewrites instruction priority, expands refusal-blocked phrases, persists across sessions, and shows a green active indicator.