dsh-smart-charts
Run the following command in DeepSeek Harness:
dsh plugin install hherosoul/dsh-smart-charts
Paste the following prompt into your AI chat to install this plugin:
Run dsh plugin install hherosoul/dsh-smart-charts in your terminal, or grab a local tarball from https://github.com/hherosoul/dsh-smart-charts to install the Smart Charts plugin.
About this plugin
Turning a CSV or Excel sheet into an interactive chart used to mean writing verbose ECharts config, wrestling with encodings and delimiters, and manually stitching together multiple reports. dsh-smart-charts compresses that entire pipeline into a single natural-language prompt: the agent detects the data shape, recommends the right chart type, and emits a self-contained HTML file you can open instantly, all offline with zero hand-written configuration.
Under the hood the plugin ships 26 chart types covering trend, share, flow, word Frequency, set overlap and more, with three theme presets (default, classic, dark). Multi-file merging picks vertical concatenation or horizontal joining based on column overlap; pandas cleansing code generated by the LLM passes through a three-layer sandbox (blacklist, AST whitelist, safe builtins) and returns structured errors the agent can auto-correct without user intervention. Every ECharts bundle is inlined into the HTML, so rendering works with no network access.
It suits product managers, operators, and analysts inside a DSH session who regularly need to turn scattered spreadsheets into a set of interactive, deliverable charts, where the transformation logic is generated by the model based on data semantics and the human simply reviews the output.
Use Cases
- Merge multiple sales CSVs and generate interactive bar charts in one prompt
- Convert Excel trend data into line and area charts with LLM-written annotations
- Deliver a set of interactive ECharts dashboards in a fully offline environment
Best For
- Product managers and operators who handle frequent data reports
- Business analysts who need quick chart output inside DSH sessions
- Developers who prefer natural-language-driven chart generation without writing ECharts config
Related Plugins
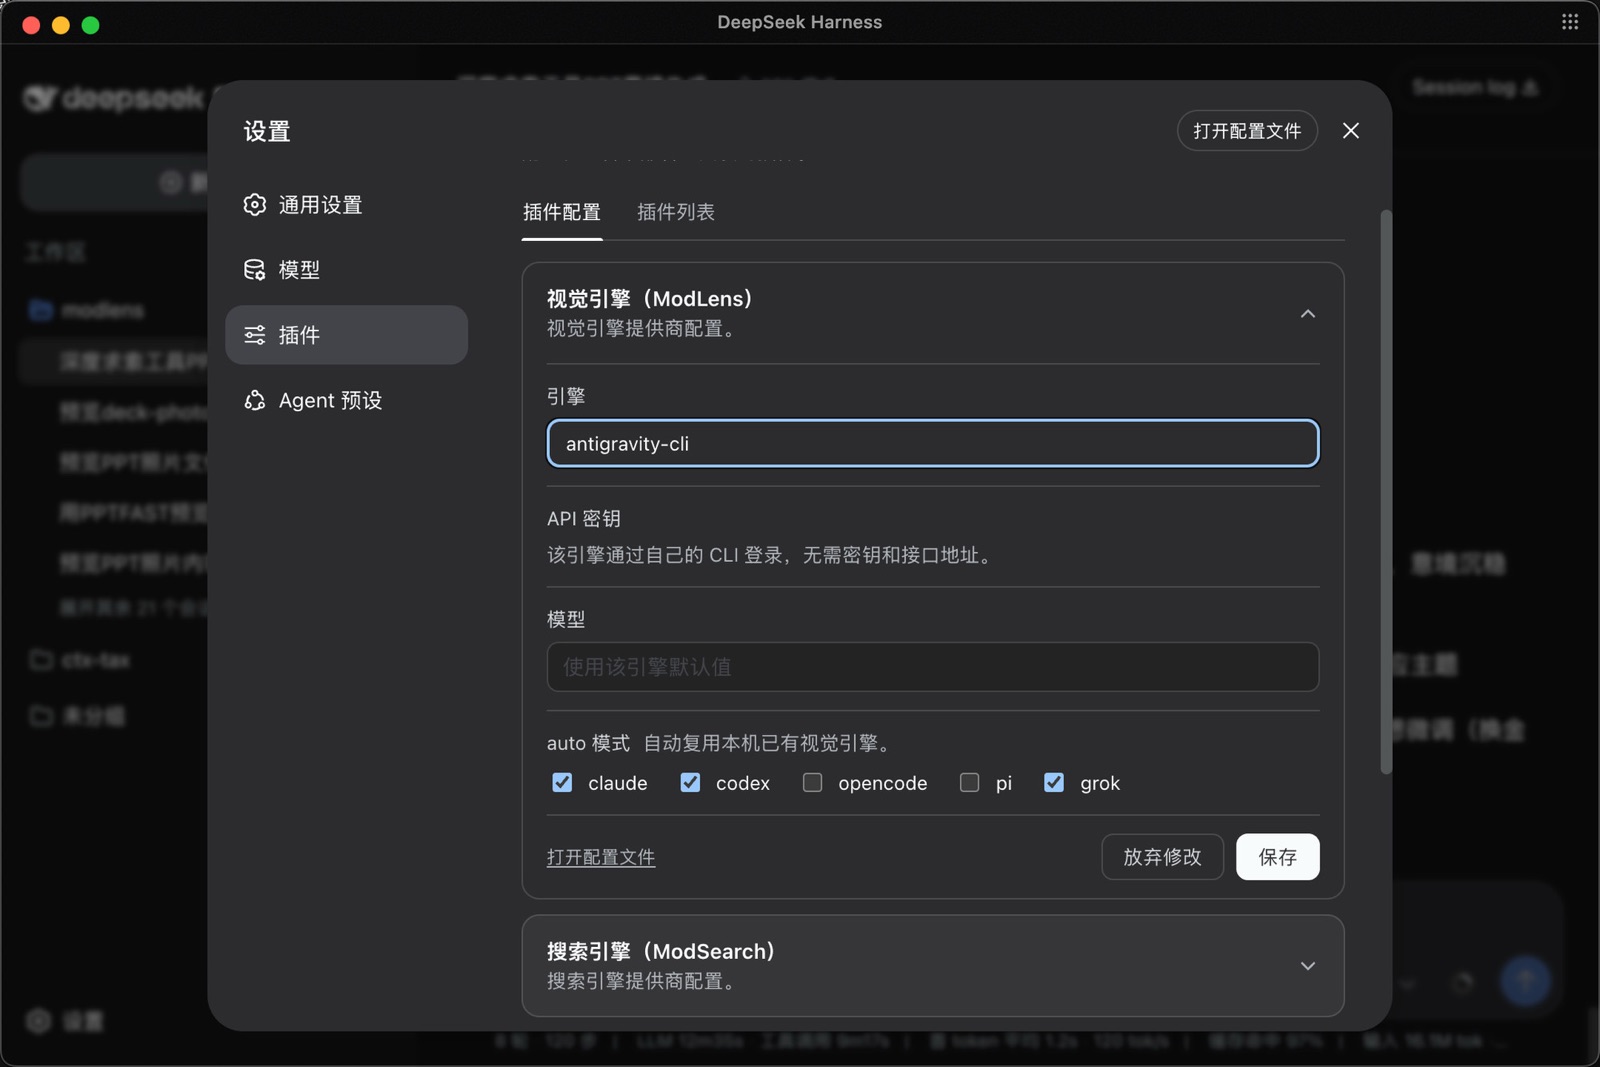
ModLens is a vision plugin for DeepSeek Harness that gives text-only models sight by reading images pasted directly into chat, with zero-config setup and multiple vision engines.
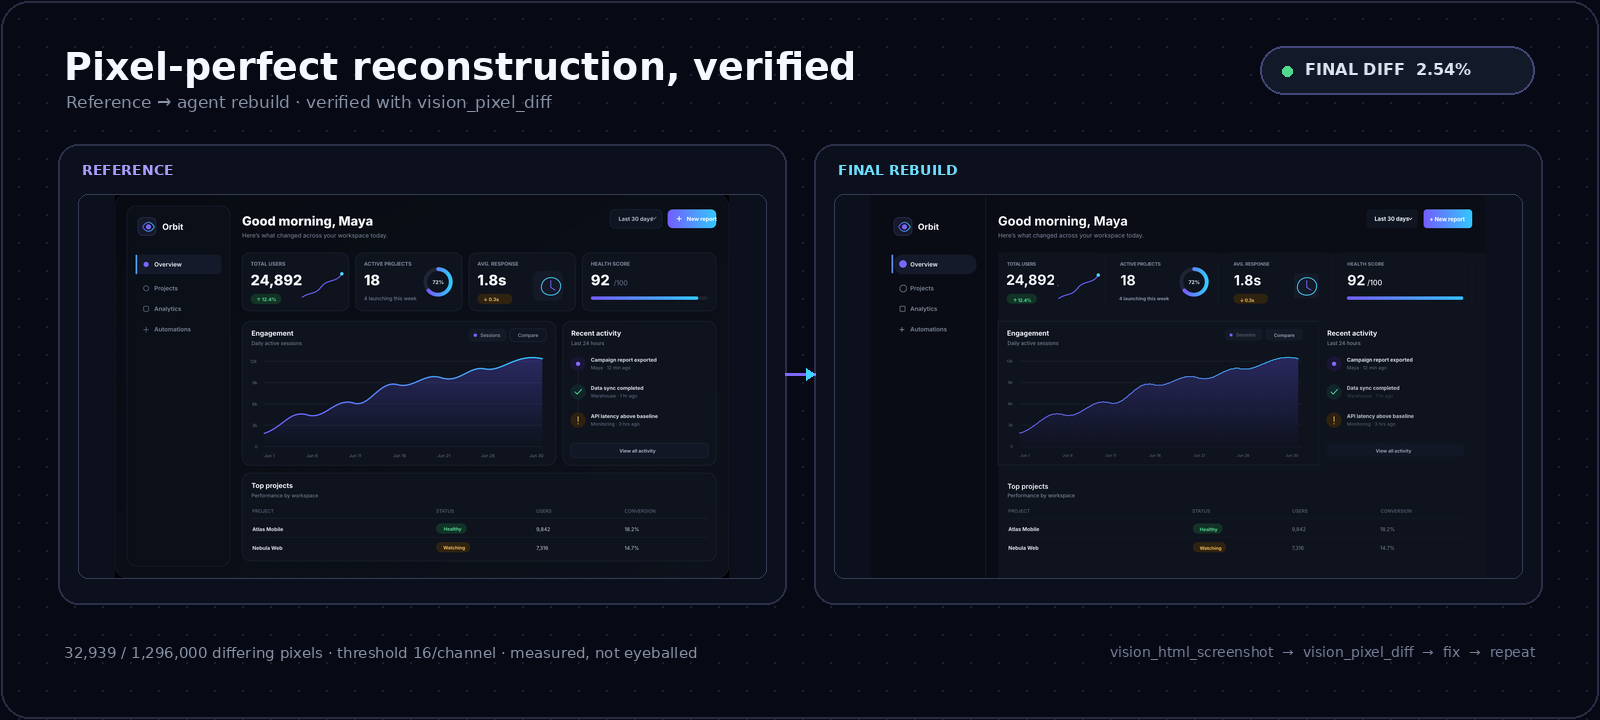
On-demand vision for text-only DeepSeek Harness agents: built-in free keyless vision chain and 14 vision tools, routing image turns as tool calls to vision models with pixel fidelity, no Python needed, one-command install.
Give text-only models in DeepSeek Harness eyes, enabling image Q&A, long-screenshot OCR, UI restoration, and GUI visual tasks.
An armor-breaking plugin for DeepSeek: rewrites instruction priority, expands refusal-blocked phrases, persists across sessions, and shows a green active indicator.