dsh-token-pricing
Run the following command in DeepSeek Harness:
dsh plugin install LightClear/dsh-token-pricing
Paste the following prompt into your AI chat to install this plugin:
Run dsh plugin install LightClear/dsh-token-pricing in your terminal to add the plugin to DeepSeek Harness; the source repository is at https://github.com/LightClear/dsh-token-pricing.
About this plugin
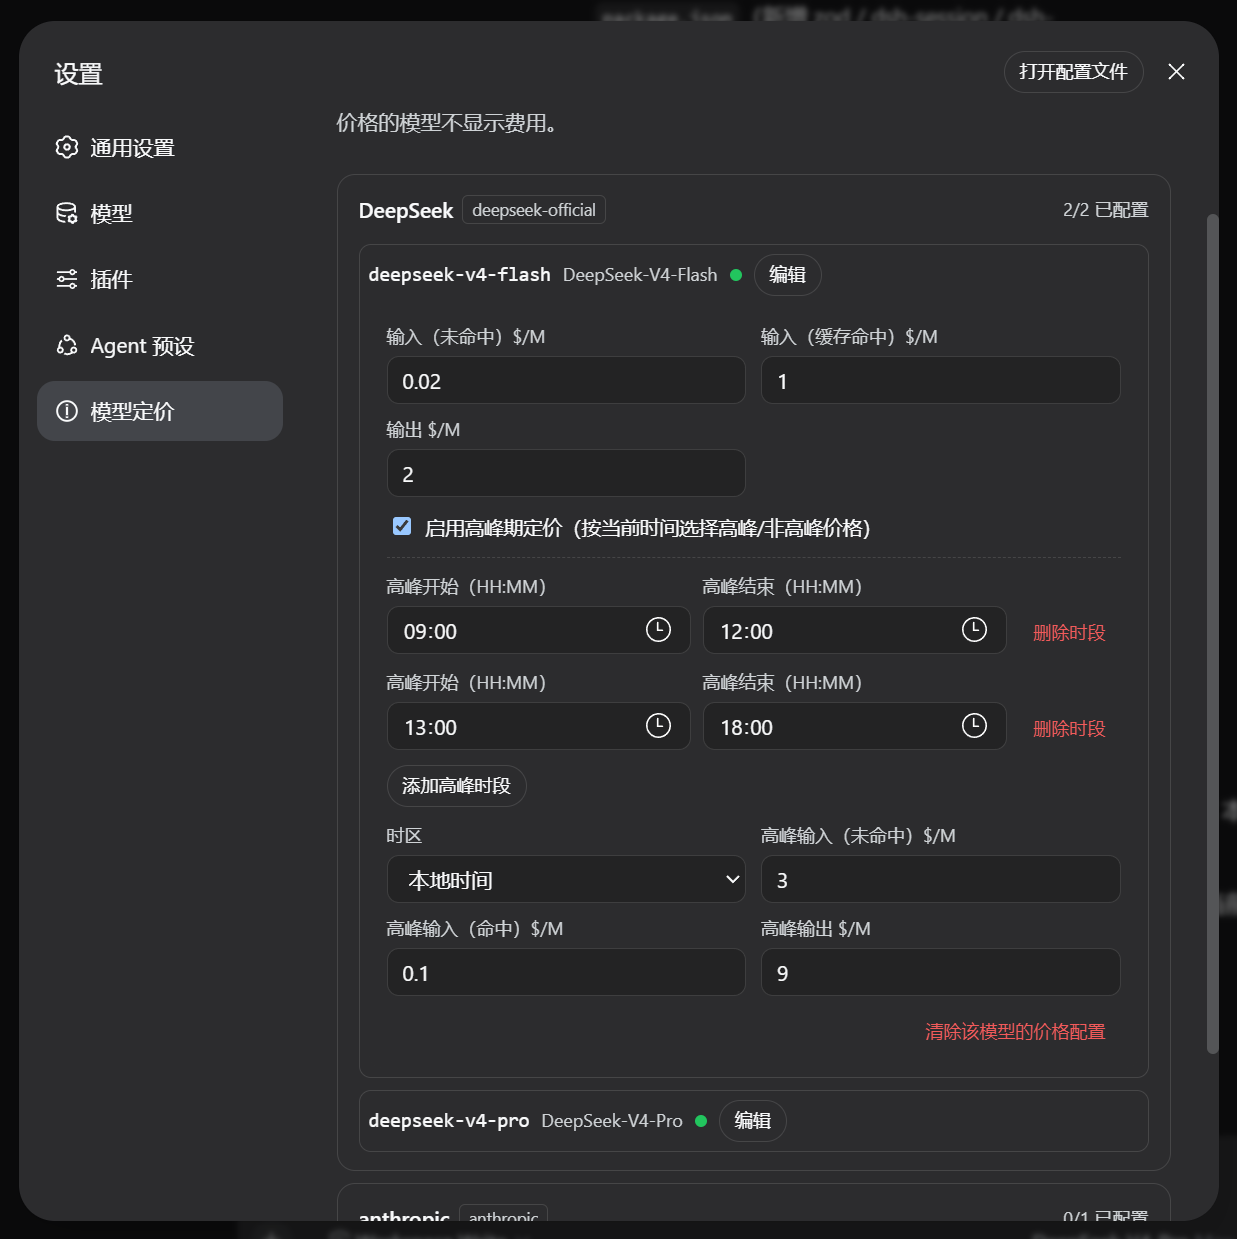
Running a multi-provider inference workflow means your cost only appears on the month-end API invoice, while day-to-day you have no idea how much each turn or each model is actually costing. dsh-token-pricing fills that gap inside the DeepSeek Harness settings panel: a per-provider, per-model pricing editor where you set three base rates (uncached input, cache-hit input, output, all in USD per million tokens) and then add any number of peak-hour windows — including windows that cross midnight — that automatically switch to a higher rate whenever a request lands inside one. Because every computation is client-side, editing a rate instantly re-prices the entire conversation history without sending a single extra token to any model.
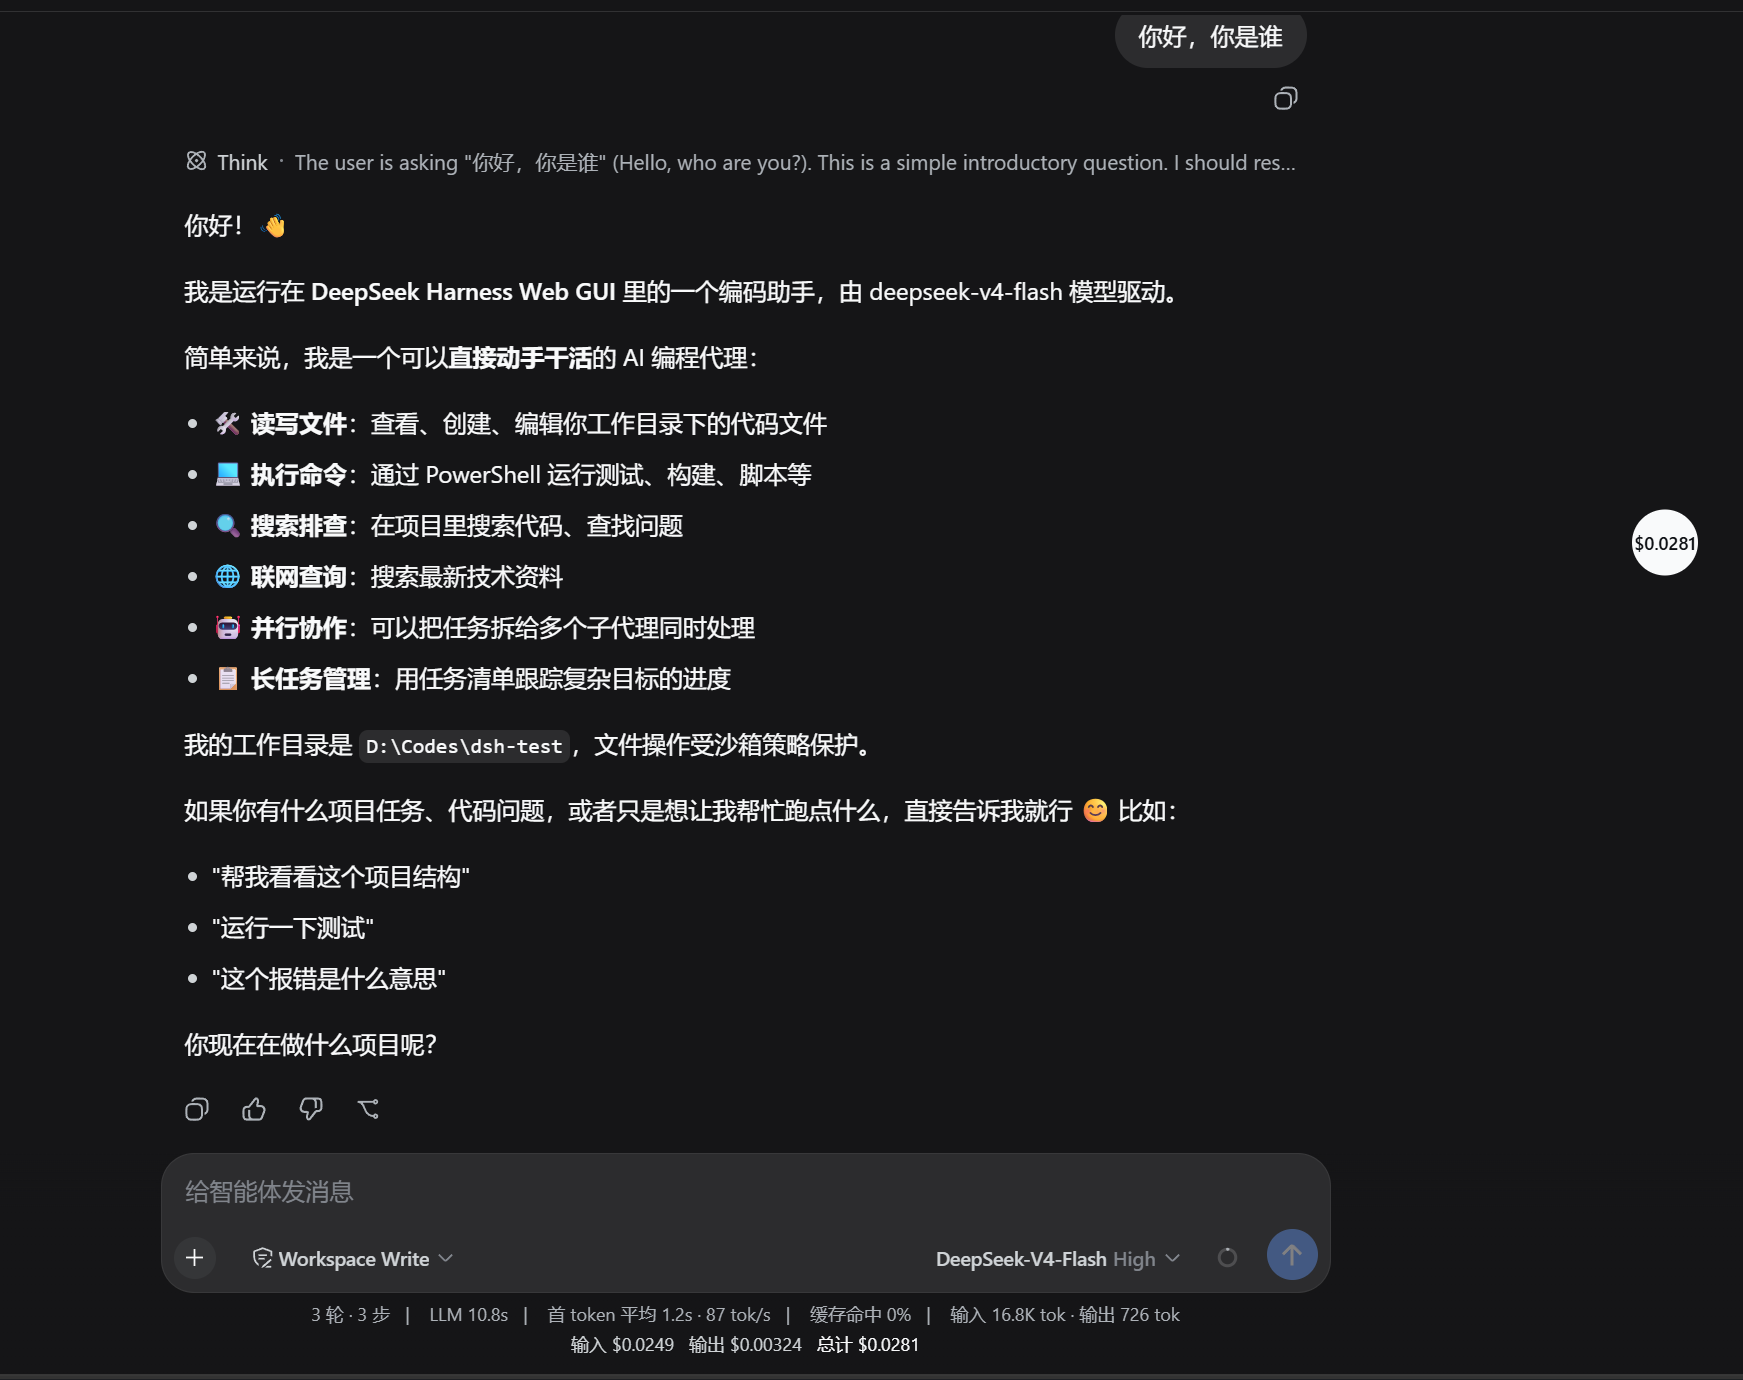
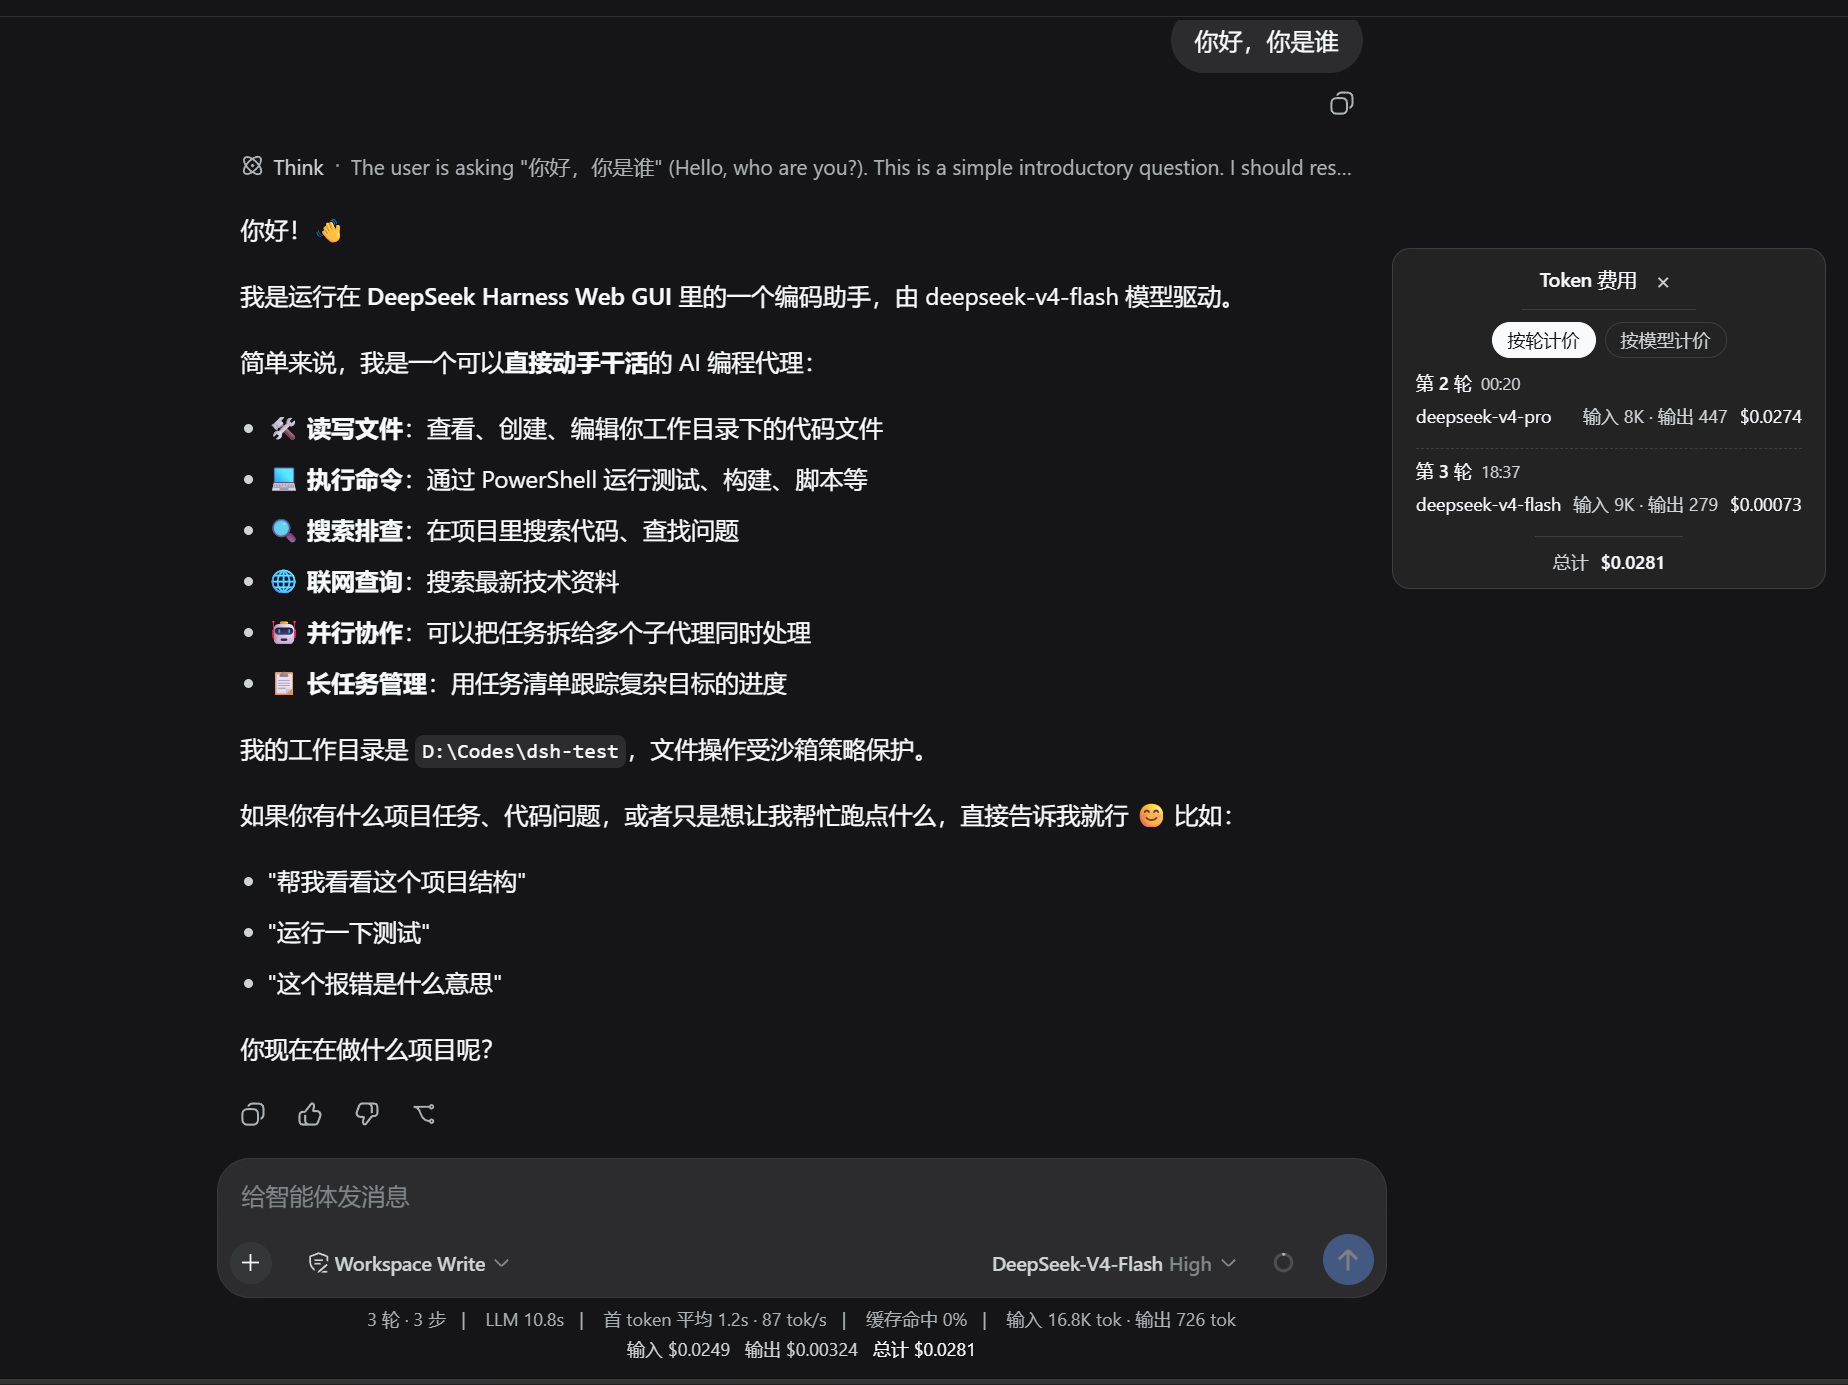
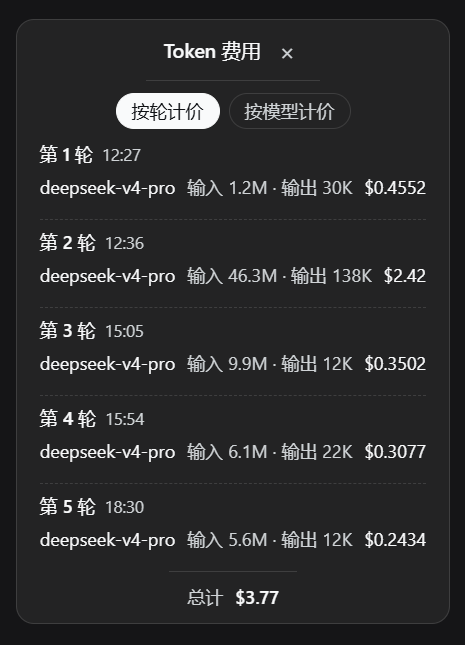
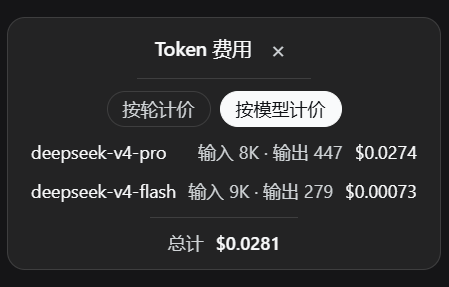
On the surface, the session data bar at the bottom of the chat shows live figures for input, output, and total cost. A collapsible, draggable widget in the corner expands into a two-tab panel: a per-turn view that lists each round with its routing, token counts, and fee (splits into multiple rows when the model changes mid-turn), and a per-model view that aggregates tokens and fees across every model used in the session, flagging any model that has no pricing rule configured. Both views share a bottom total bar that is structurally identical to the data-bar reading, so the numbers always agree.
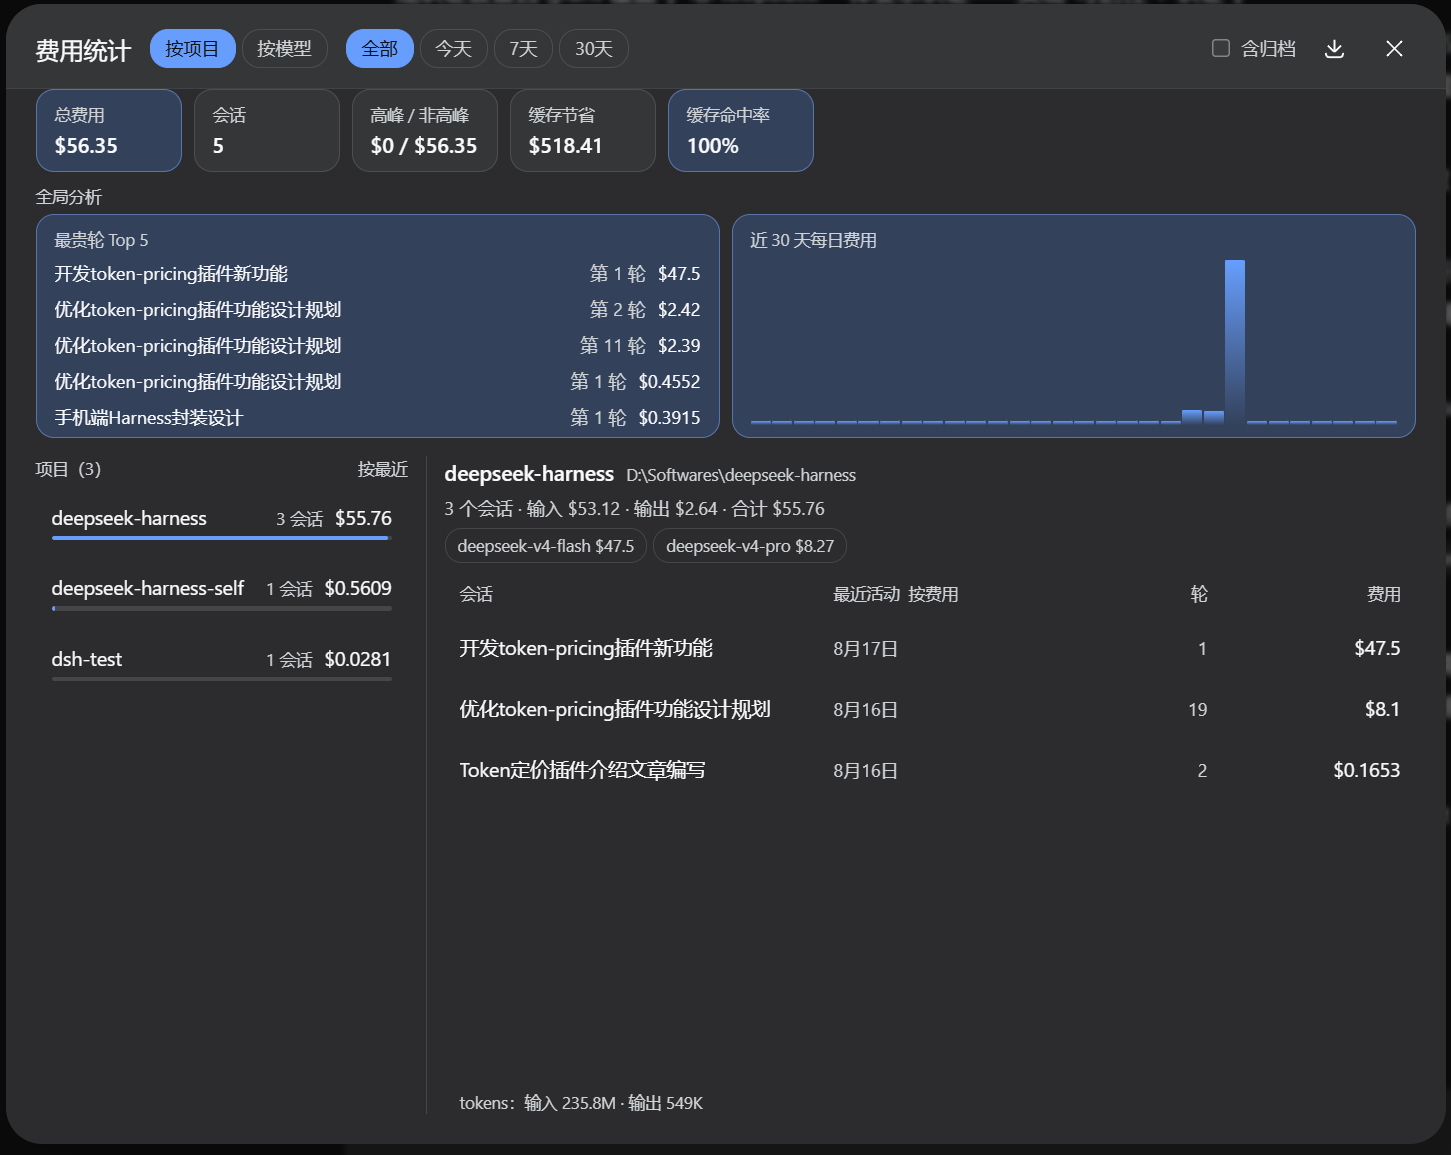
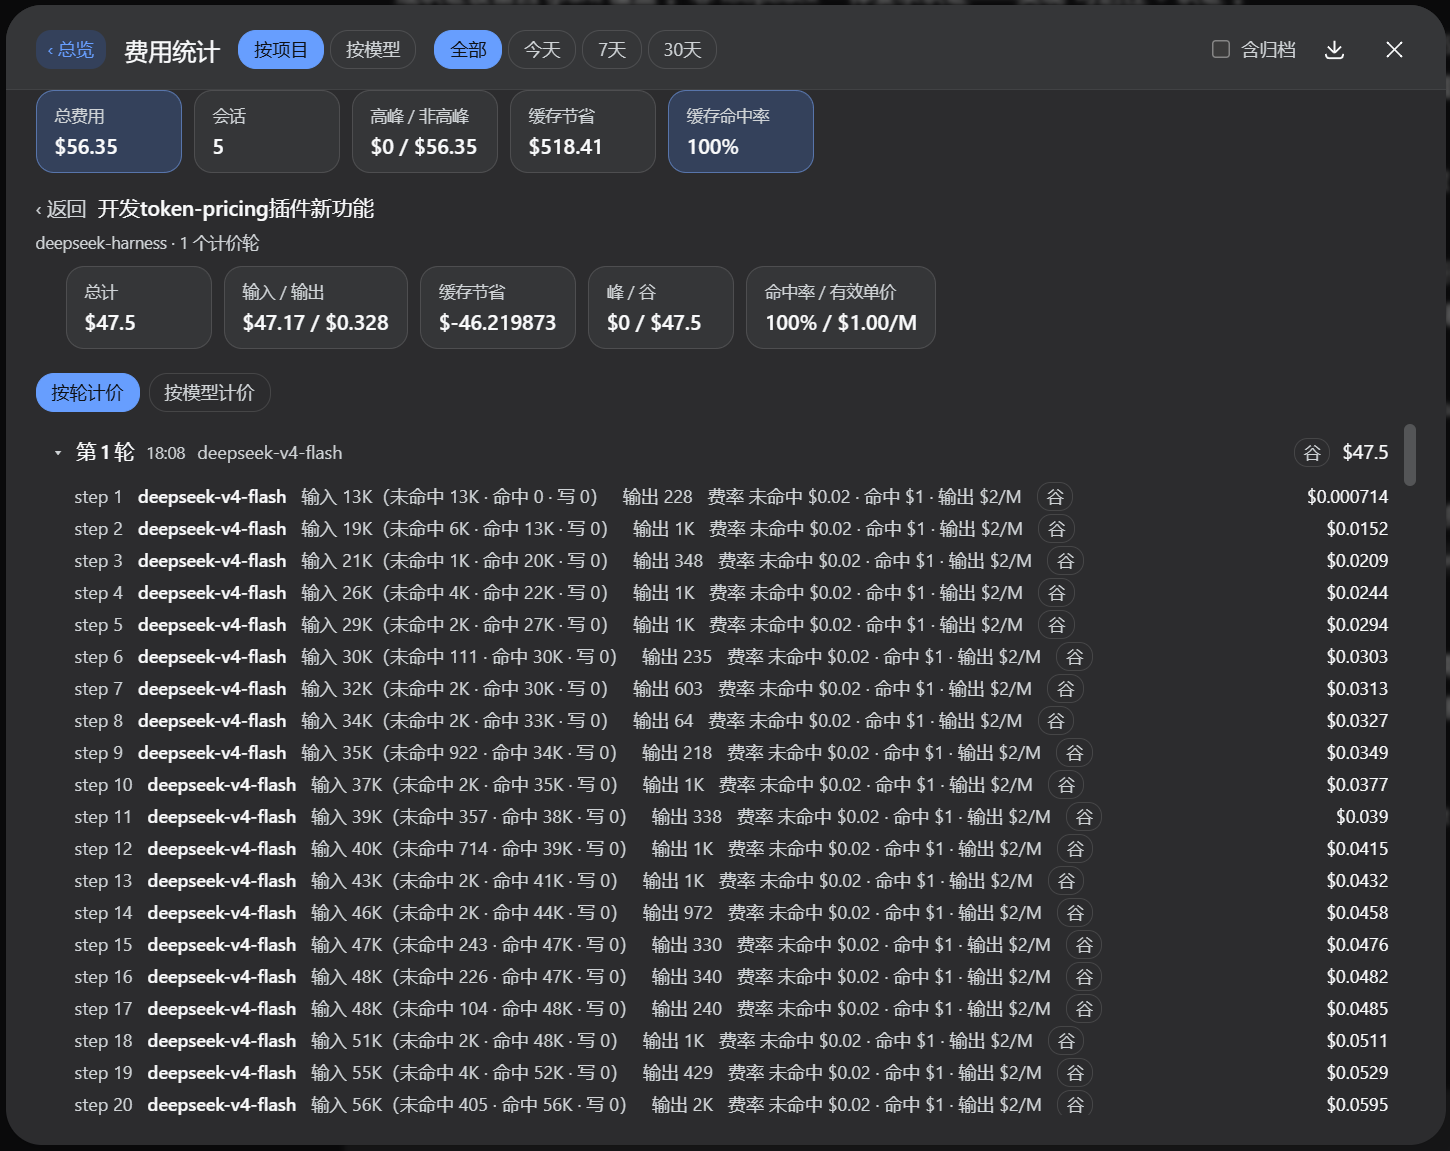
The cross-project analytics panel, reached from a small icon in the sidebar, widens the lens to every project and every conversation. It offers two dimensions — by project (cost-share bars plus a session table) and by model (three-bucket input split, cache-hit rate, effective USD/M, peak/off-peak breakdown, cache savings) — both funnelling into the same session detail page where each turn row expands into step-level detail (uncached / cached / write tokens, applied rate, peak tier, step cost). A top bar provides time-window filters, a global analysis zone showing the five most expensive turns and a 30-day daily-cost strip, and a one-click CSV export (UTF-8 BOM). Child-agent sessions roll their fees into the parent row with a marker, keeping the ledger clean.
Who is it for? If you mix providers and models on a daily basis and want to see the true cost of every turn and every model in real time, and need to quickly drill into the priciest project, model, or turn when the invoice arrives, this plugin was built for you. It adds zero tokens to any prompt, registers no tools, injects nothing into the request path — it is pure client-side aggregation, lightweight and ready to use out of the box.
Screenshots

Use Cases
- Check per-turn token cost and peak/off-peak rate while debugging multi-model workflows
- Drill into the priciest conversations and models before month-end review and export CSV
- Configure peak-hour rates so local readings match the actual billing statement
Best For
- Developers juggling multiple LLM providers on a daily basis
- Engineers who manage shared inference budgets for a team
- Power users who want real-time cost visibility instead of waiting for the invoice
Related Plugins
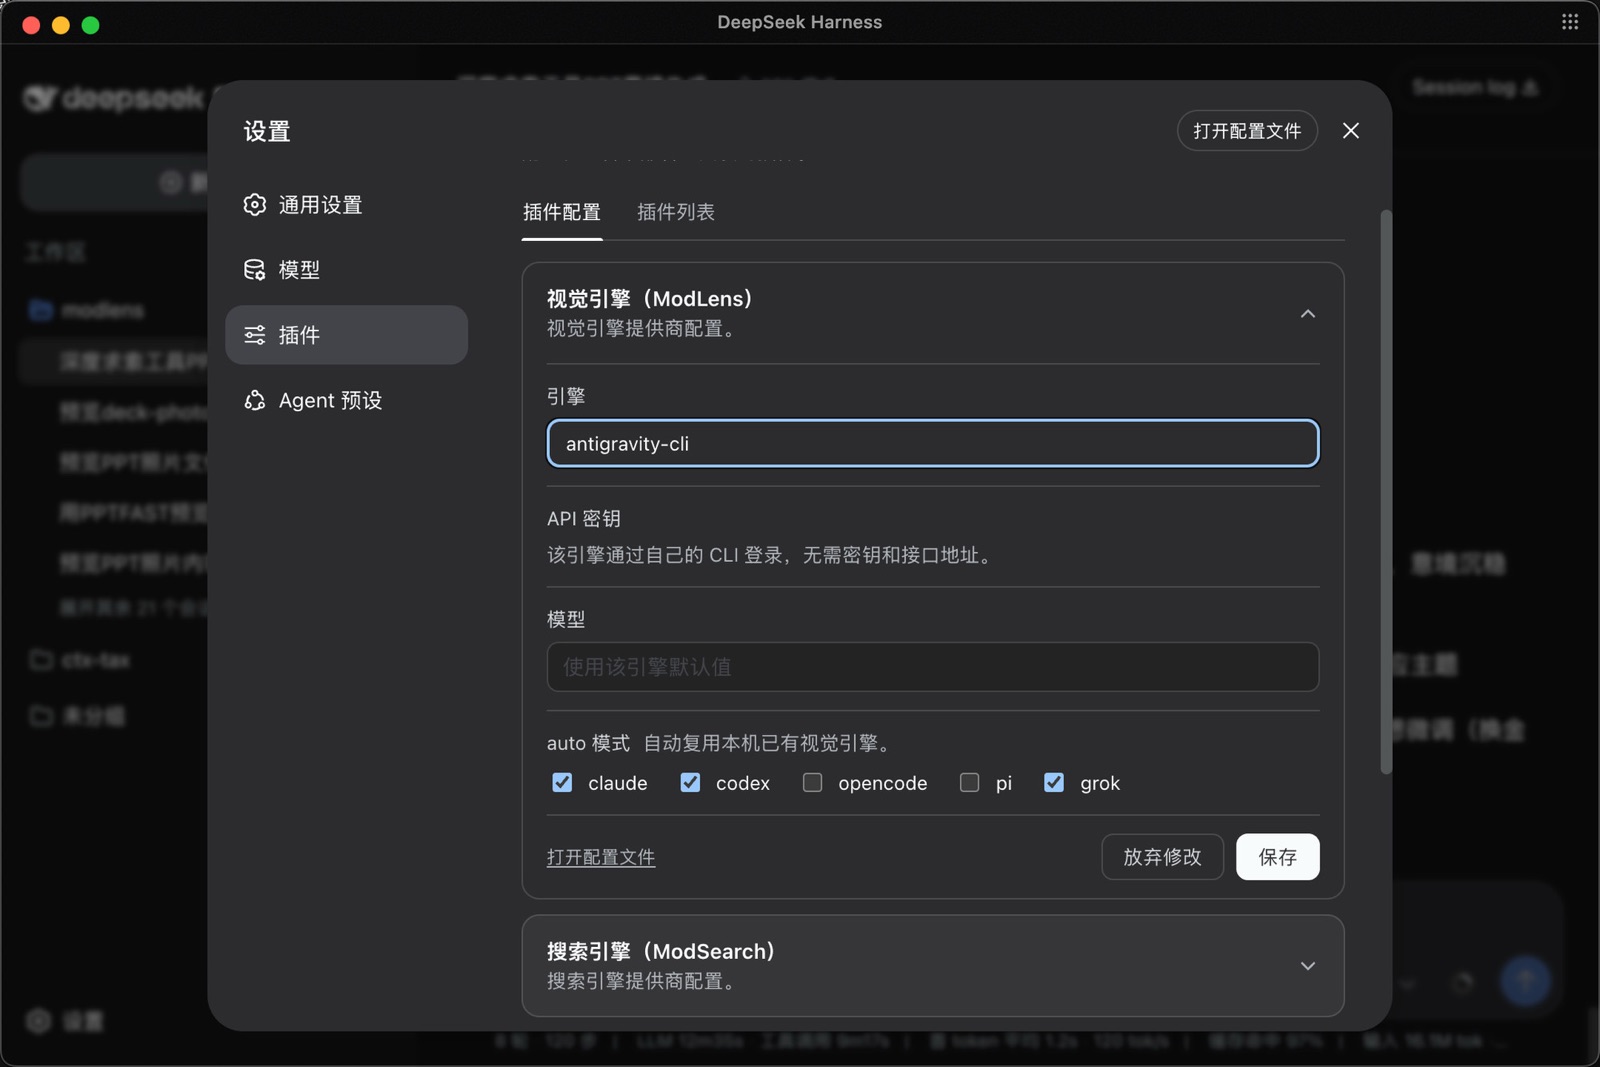
ModLens is a vision plugin for DeepSeek Harness that gives text-only models sight by reading images pasted directly into chat, with zero-config setup and multiple vision engines.
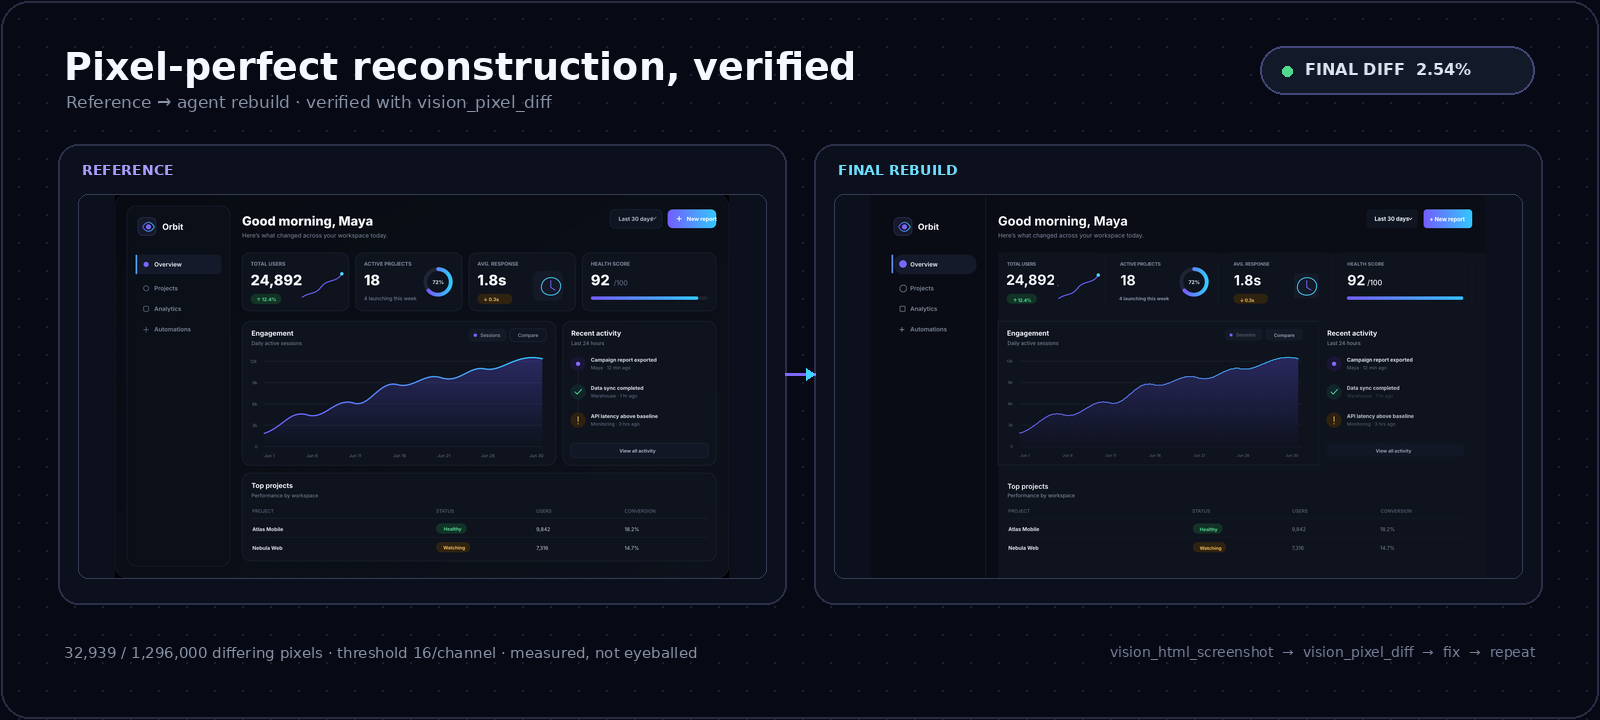
On-demand vision for text-only DeepSeek Harness agents: built-in free keyless vision chain and 14 vision tools, routing image turns as tool calls to vision models with pixel fidelity, no Python needed, one-command install.

Give text-only models in DeepSeek Harness eyes, enabling image Q&A, long-screenshot OCR, UI restoration, and GUI visual tasks.
An armor-breaking plugin for DeepSeek: rewrites instruction priority, expands refusal-blocked phrases, persists across sessions, and shows a green active indicator.