dsh-o11y-plugin
Run the following command in DeepSeek Harness:
dsh plugin install fly3366/dsh-o11y-plugin
Paste the following prompt into your AI chat to install this plugin:
Install in DeepSeek Harness by running dsh plugin install fly3366/dsh-o11y-plugin; full source code: https://github.com/fly3366/dsh-o11y-plugin
About this plugin
DeepSeek Harness ships built-in session-level OpenTelemetry telemetry but exposes no plugin-scoped metric or log pipeline to third-party plugins. The result is that every plugin wanting standard, consistent observability had to wire up its own providers, exporters, and configuration—a repetitive and error-prone task. dsh-o11y-plugin closes that gap in a single, drop-in step.
On startup the plugin registers global OpenTelemetry providers once. From that point on, any plugin that calls trace.getTracer(), metrics.getMeter(), or logs.getLogger() from @opentelemetry/api automatically exports traces, metrics, and logs through one consistently configured pipeline. It also bridges dsh session telemetry into the OTel log stream so platform-level and plugin-level data share a single timeline. Every knob—service name, OTLP/HTTP endpoint, per-signal toggles, metric export interval—is surfaced under the o11y namespace in the dsh Web settings UI for easy inspection and tuning.
It is built for dsh plugin authors who want community-compatible, standardized observability without re-implementing OTel plumbing per plugin. The plugin is stateless, writes no files, reads no credentials, and buffers telemetry in memory until the OTLP endpoint is reachable; if no collector answers, batches are dropped silently with no side effects. It is implemented on the official OpenTelemetry Node.js SDK, the same dependency family dsh uses for its own session telemetry, ensuring upstream and downstream compatibility out of the box.
Screenshots
Use Cases
- Export traces, metrics, and logs from any dsh plugin through a single OTel pipeline
- Bridge dsh session telemetry into the unified OTel log stream
- Tune service name, endpoint, and per-signal toggles from the dsh Web settings UI
Best For
- dsh plugin authors who need standardized observability without re-implementing OTel per plugin
- Teams that want plugin telemetry on the same OTel timeline as platform session telemetry
- Builders seeking community-compatible OpenTelemetry export for their inference plugins
Related Plugins
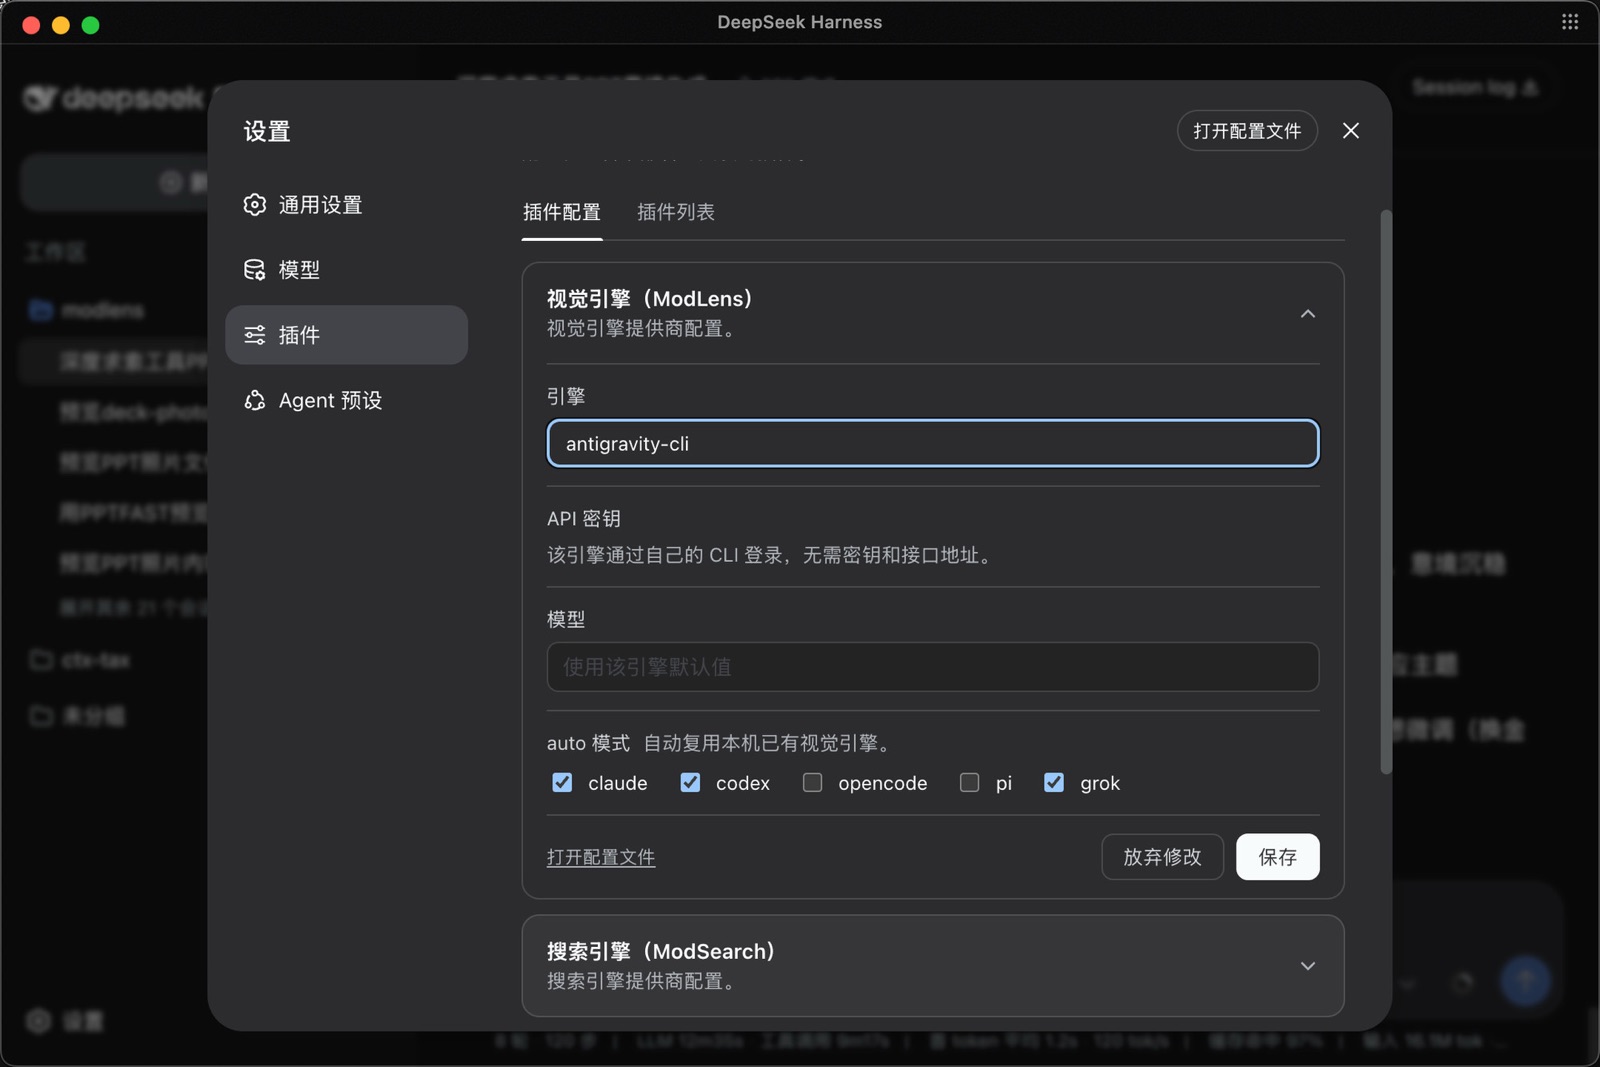
ModLens is a vision plugin for DeepSeek Harness that gives text-only models sight by reading images pasted directly into chat, with zero-config setup and multiple vision engines.
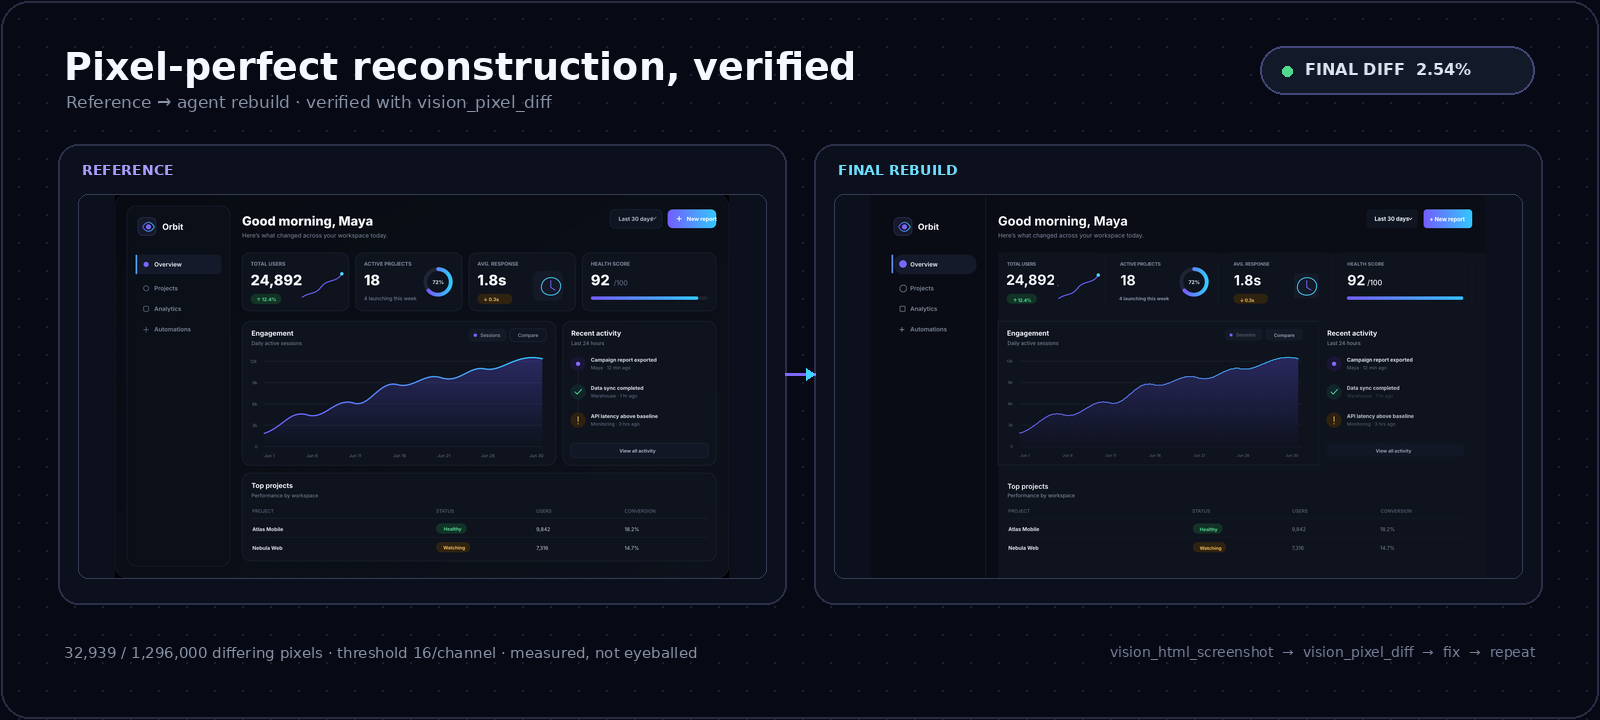
On-demand vision for text-only DeepSeek Harness agents: built-in free keyless vision chain and 14 vision tools, routing image turns as tool calls to vision models with pixel fidelity, no Python needed, one-command install.

Give text-only models in DeepSeek Harness eyes, enabling image Q&A, long-screenshot OCR, UI restoration, and GUI visual tasks.
An armor-breaking plugin for DeepSeek: rewrites instruction priority, expands refusal-blocked phrases, persists across sessions, and shows a green active indicator.