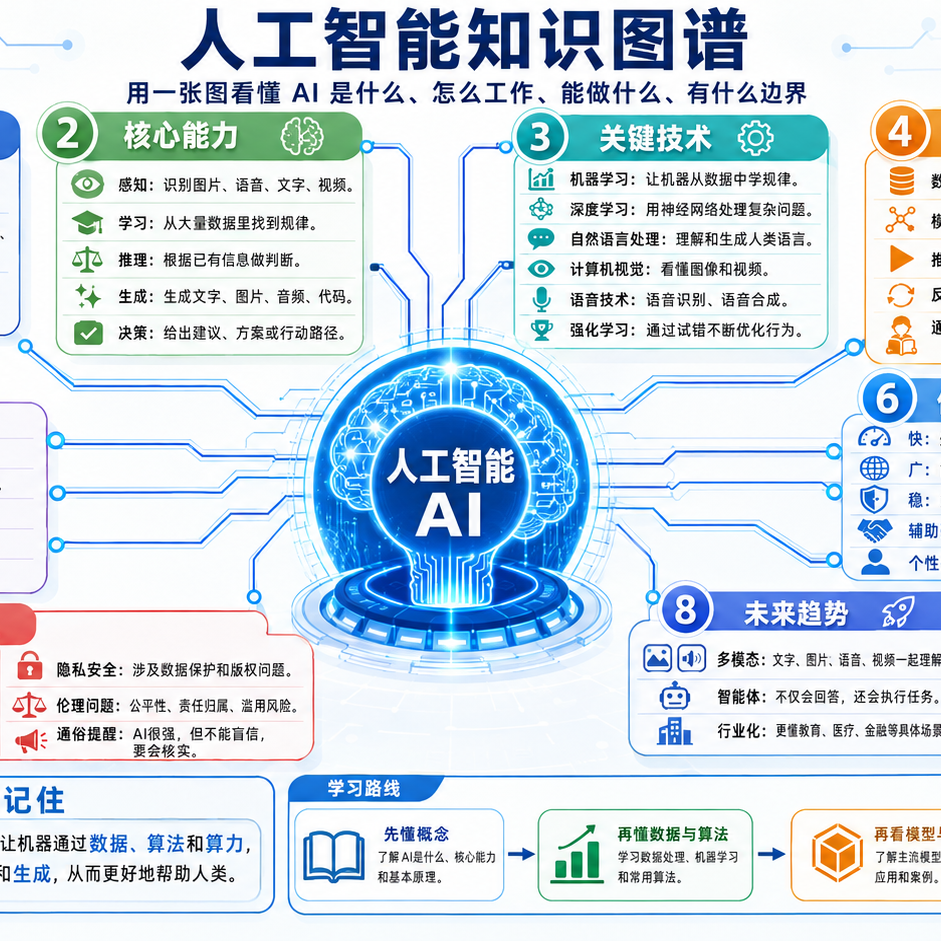
Knowledge Graph Visualizer Expert
Paste the following prompt into your AI chat to install this skill:
Please follow https://skillhub.cn/install/skillhub.md to install @user_ca803213/knowledge-graph-visualizer-skill into your AI assistant.
About this skill
Problem
Course, competency, and knowledge structures are often kept as outlines, tables, or scattered notes. Turning them into diagrams by hand can drop hierarchy or relationship labels, while maintaining Mermaid, Graphviz, and interactive HTML separately creates inconsistent versions of the same graph.
How It Works
The skill expects a unified stage-one JSON object with nodes, edges, and optional metadata; if only a course or topic name is supplied, it first constructs that stage-one graph. It then emits a fixed sequence of outputs: raw JSON, Mermaid, Graphviz DOT, Markdown hierarchy, a single-file HTML visualization, and a static image prompt or image when available. The HTML page uses a D3.js force-directed layout with drag, zoom, node details, neighbor highlighting, search, reset, a type legend, curved directed edges, and arrow markers. All formats preserve the same graph data, with matching node and edge counts, which makes it useful for visualizing modules, knowledge points, methods, cases, activities, and assessment items.
Boundaries
This skill is best for teaching, research, and concept explanation. It does not require a backend and should not mutate the source graph during visualization. Mermaid and Graphviz output still depend on the rendering environment, and dense graphs with many Chinese labels may need careful zooming. The single-file HTML should remain self-contained except for the D3 CDN. For readable course graphs, keep the input around 18 to 35 nodes and 20 to 45 edges unless a larger structure is explicitly requested.
Use Cases
- Split a course outline into modules, knowledge points, methods, and cases, then generate a draggable and searchable HTML knowledge graph.
- Convert existing node and edge JSON into Mermaid, Graphviz DOT, and Markdown hierarchy from the same source data.
- Create a static image prompt for teaching or research concepts while preserving nodes, edges, colors, and relationship labels.
- Audit a course graph for missing nodes or edges, then produce a reviewable single-file webpage in the required output order.
Best For
- Curriculum designers or instructional coordinators who need to turn course outlines into clear, interactive concept maps.
- Researchers who need to combine concept notes into a research framework and export the same JSON into multiple graph formats.
- Engineers preparing teaching materials or technical talks who want searchable, zoomable web graphs that highlight adjacent nodes.
- Product or content operations staff maintaining knowledge bases who need Markdown hierarchies and legends to explain course structure.
Related Skills

Turns Taleb's antifragility, barbell strategy, and via negativa into executable prompts for risk analysis in career, investing, health, and other domains.

Keyword news search over ZAKER’s corpus with optional time filtering, returning up to 20 titles, authors, and summaries.

A generic knowledge review skill that generates role-based checklists, rrule-based reminders, and on-demand reviews without storing personal data.

A knowledge-management skill for layered retrieval across information sources.