dsh-axia-cachebilling
Run the following command in DeepSeek Harness:
dsh plugin install Animal2404/dsh-axia-cachebilling
Paste the following prompt into your AI chat to install this plugin:
Run dsh plugin install Animal2404/dsh-axia-cachebilling in the DeepSeek Harness terminal to install this plugin; the source repository is at https://github.com/Animal2404/dsh-axia-cachebilling . After installation, restart DSH and open the context-usage popover on any active session to see the live billing panel.
About this plugin
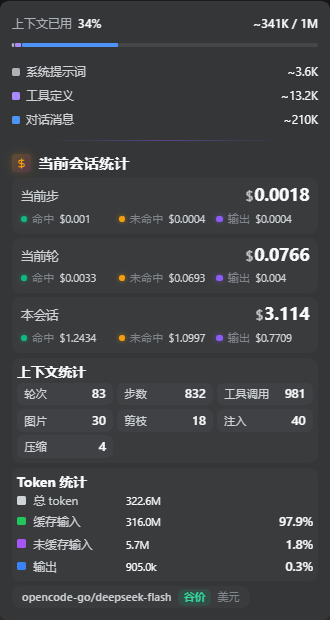
The longer a DSH session runs, the thicker the context grows, and well over ninety percent of the final bill often lands on cache reads—yet most users have zero real-time visibility into where that money actually goes. dsh-axia-cachebilling solves this by embedding itself directly into DSH's built-in context-usage popover. No new tab, no overlay, no interruption to your chat: the live cost breakdown sits right where you already look at token occupancy.
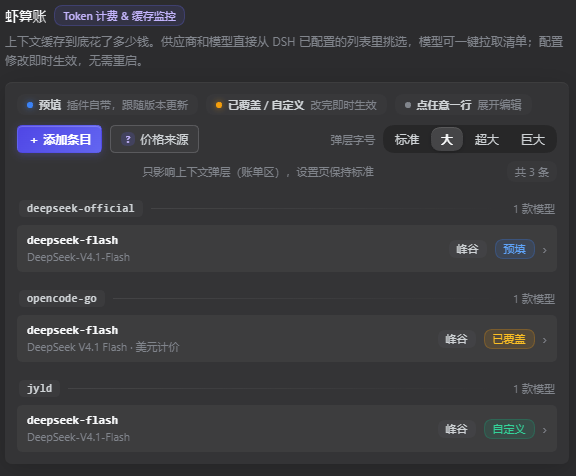
The core capabilities come in three tiers. First, a three-level bill: current step, current turn, and whole session, each showing a total split into cache-hit, cache-miss, and output line items, with a model capsule at the bottom noting provider, peak/valley rate, and currency. Second, context statistics: seven hard-counted metrics—turns, steps, tool calls, images, prunes, injections, compressions—all derived from actual session log events rather than estimates or ratio math, with compression carrying an estimated cost figure. Third, token statistics: one total line plus three component lines, each with both percentage and absolute count. On the billing side, multi-currency amounts are auto-normalized via live FX rates (with local caching and graceful fallback to side-by-side display if rates are unavailable); peak and valley time windows are priced separately; third-party relays are billed by catalog model match. A built-in price directory covers Open Code, GLM, Kimi, MiniMax, and more; custom entries or overrides take effect immediately with no restart.
Who it is for: heavy DSH users whose single sessions stretch past dozens of turns and who want to know exactly how much each request spends on cache versus generation; developers juggling multiple providers and relay routers who need to track costs across peak and valley windows; or anyone simply curious how many images, tool calls, or compressions have quietly piled up in their context. Open the context-usage popover on any active session and the bill is right there, sitting beside your chat.
Screenshots
Use Cases
- Inspect per-step, per-turn, and per-session cache hit vs output cost breakdown
- Track billing differences across providers under peak and valley pricing windows
- Monitor context events like tool calls and compressions alongside token consumption in long sessions
Best For
- Heavy DSH users whose sessions regularly exceed dozens of turns
- Developers juggling multiple providers and third-party relay routers
- Teams that need precise billing visibility into cache-read cost ratios
Related Plugins
A service-oriented sidebar framework for DSH, offering a full workbench with file explorer, embedded browser, real terminal, Git panel, and extensible plugin services.

A beautiful, practical Claude Code-style TUI plugin with pixel whale top bar, flowing glow title, real-time status line, streaming thought expansion, time rewind, context progress bar and TPS gauge — zero core changes.

The plugin market for DeepSeek Harness: browse/search/one-click install community plugins and themes, with updates, backup/restore, hot disable, diagnostics, and AI fix.

A persistent whale widget on the DSH web UI that shows DeepSeek balance, today's usage, and per-turn cost, with drag-and-snap and sound effects.