zcode-usage-stats
Run the following command in DeepSeek Harness:
dsh plugin install Amer-CN/zcode-usage-stats
Paste the following prompt into your AI chat to install this plugin:
Run dsh plugin install Amer-CN/zcode-usage-stats in your terminal to install the plugin; the source is available at https://github.com/Amer-CN/zcode-usage-stats. After installation, restart the DSH process to access the usage statistics panel in Settings.
About this plugin
The more you chat with DeepSeek Harness, the harder it is to build a sense of scale around token spend. How much did I use today? Which model burns the most? On which day was I most productive? All of those answers live in your local session history; nobody has been tallying them for you. zcode-usage-stats puts that ledger on the screen.
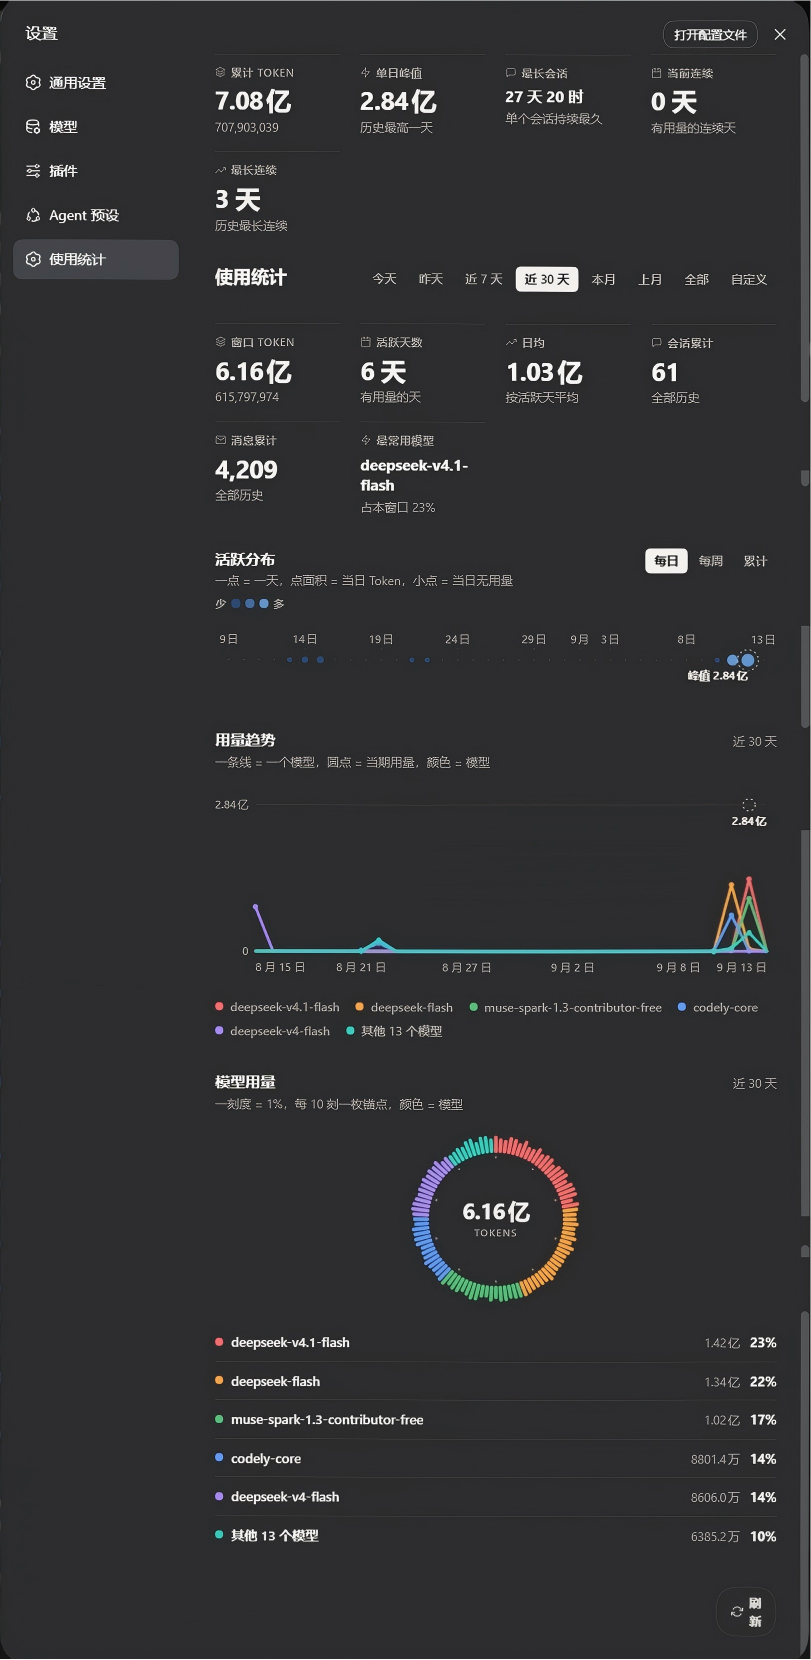
It scans every session under ~/.dsh, attributes each token to a day, an hour, and a model, then renders three primary views: a calendar-dot heatmap for activity rhythm, a line chart for daily usage trends, and a tick-ring gauge for per-model share. A top strip shows cumulative tokens, single-day peak, longest streak, and other at-a-glance metrics. Every chart is hand-written SVG with zero runtime chart-library dependencies; the dual-track color palette is fully custom and both light and dark themes pass WCAG AA contrast checks. Aggregation uses an in-memory plus disk two-tier cache so the first paint is never blocked by a full scan, and all computation and rendering stay on your machine with no external network calls.
Built for heavy DSH users, developers who switch between multiple models, and anyone who wants to put a number on their usage rhythm and cost distribution. Open the Usage Statistics page in Settings and start reading your data; no extra setup required.
Screenshots
Use Cases
- Break down token spend by day and by model to see which model costs the most and which day peaks
- Get an at-a-glance per-model usage share on a dashboard while switching between multiple models
- Review personal usage rhythm with a calendar heatmap and trend chart to spot the most active days and longest streaks
Best For
- Developers whose daily workflow runs heavily on DeepSeek Harness
- Users who rotate between multiple models and track cost distribution and usage trends
- Privacy-conscious users who insist on fully local computation with data never leaving the machine
Related Plugins
A service-oriented sidebar framework for DSH, offering a full workbench with file explorer, embedded browser, real terminal, Git panel, and extensible plugin services.

A beautiful, practical Claude Code-style TUI plugin with pixel whale top bar, flowing glow title, real-time status line, streaming thought expansion, time rewind, context progress bar and TPS gauge — zero core changes.

The plugin market for DeepSeek Harness: browse/search/one-click install community plugins and themes, with updates, backup/restore, hot disable, diagnostics, and AI fix.

A persistent whale widget on the DSH web UI that shows DeepSeek balance, today's usage, and per-turn cost, with drag-and-snap and sound effects.