dsh-usage-monitor
Run the following command in DeepSeek Harness:
dsh plugin install NOirBRight/dsh-usage-monitor
Paste the following prompt into your AI chat to install this plugin:
In DeepSeek Harness, you can install this plugin by running the command dsh plugin install NOirBRight/dsh-usage-monitor or directly visiting the GitHub URL https://github.com/NOirBRight/dsh-usage-monitor.
About this plugin
Tracking token usage and API calls is a crucial yet tedious task when using DeepSeek Harness for AI development or deployment. Users need to monitor usage to control costs, optimize performance, and ensure resource allocation, but manually analyzing log data is inefficient and error-prone.
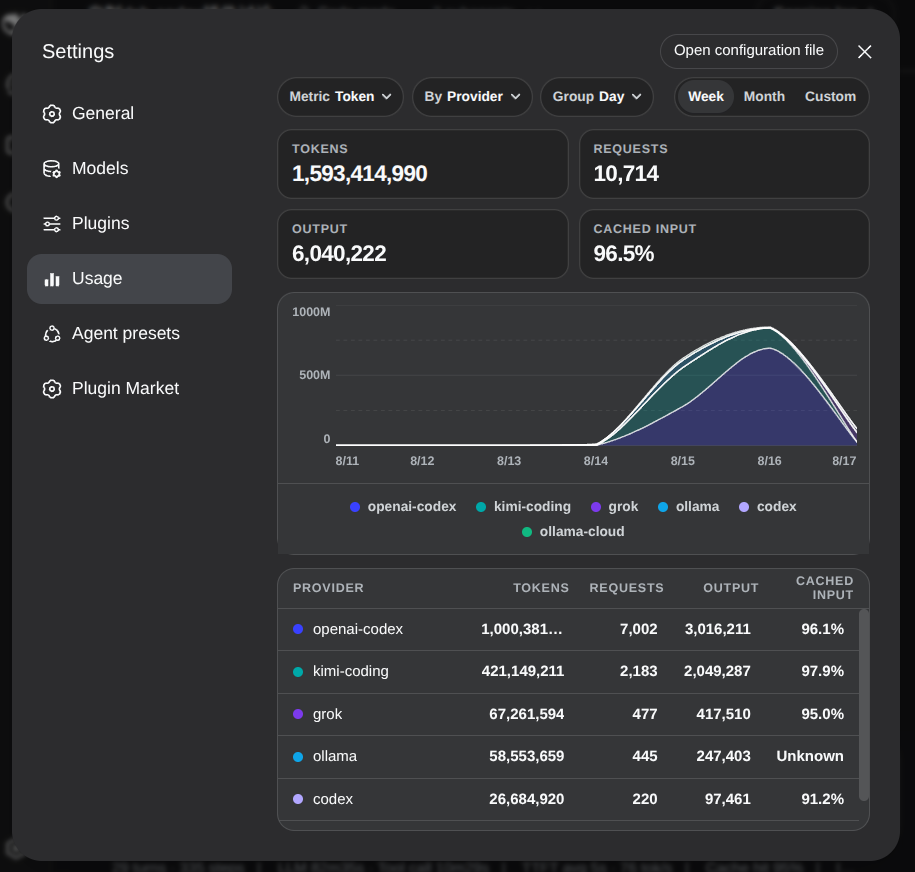
The dsh-usage-monitor plugin offers an intuitive dashboard that automatically extracts token usage data from session logs and visualizes it as charts and tables within Settings. It displays tokens, requests, output tokens, and cache-hit rates, with stacked charts supporting grouping by provider, model, workspace, and time ranges like day, week, month, or custom periods. Data processing relies on a reliable SQLite sidecar, ensuring efficient queries and durable persistence.
This plugin is ideal for all developers, data scientists, and teams using DeepSeek Harness, especially those focused on cost-effectiveness, usage monitoring, or performance tuning. It streamlines usage analysis, providing deep insights to make data-driven decisions and enhance overall workflow efficiency.
Screenshots
Use Cases
- Track API calls and token usage in real-time
- Analyze usage trends across models or providers
- Set custom time ranges to view usage reports
Best For
- Developers monitoring AI application performance
- Team managers controlling cloud service costs
- Data scientists optimizing model usage efficiency
Related Plugins
A service-oriented sidebar framework for DSH, offering a full workbench with file explorer, embedded browser, real terminal, Git panel, and extensible plugin services.

A beautiful, practical Claude Code-style TUI plugin with pixel whale top bar, flowing glow title, real-time status line, streaming thought expansion, time rewind, context progress bar and TPS gauge — zero core changes.

The plugin market for DeepSeek Harness: browse/search/one-click install community plugins and themes, with updates, backup/restore, hot disable, diagnostics, and AI fix.

A persistent whale widget on the DSH web UI that shows DeepSeek balance, today's usage, and per-turn cost, with drag-and-snap and sound effects.