
dsh-api-dashboard
Run the following command in DeepSeek Harness:
dsh plugin install 133563825as-ai/dsh-api-dashboard
Paste the following prompt into your AI chat to install this plugin:
Run the install command inside DeepSeek Harness to add this plugin; the full source code is hosted at https://github.com/133563825as-ai/dsh-api-dashboard
About this plugin
Juggling APIs from DeepSeek, Zhipu GLM, Kimi, OpenRouter, and more means repeatedly opening each provider console to check balances and usage. dsh-api-dashboard collects all those scattered numbers into a single status bar right below the input box in DeepSeek Harness: tap it for a drawer, tap a card for per-platform details - three levels of drill-down without ever leaving the chat. Platforms that do not expose a balance endpoint are honestly labeled as such; no figures are fabricated.
Core capabilities fall into three buckets: balance monitoring with customizable green-yellow-red thresholds and a push notification the first time a balance drops below the warning line; per-session cost estimation priced by model, with mixed currencies shown side by side without rate conversion; and sub-agent spend displayed as individually scrollable pills that track only the new tokens that agent produced itself. It covers six domestic and three overseas platforms out of the box, auto-detects balance endpoints on custom relays, and supports manual path mapping for self-hosted models. All settings persist to a local state file across restarts, and the in-app one-click updater handles download, verification, backup, and rollback automatically.
Best suited for developers running multiple provider APIs inside DeepSeek Harness (mobile DSHA or desktop) who need a real-time cost pulse, especially when orchestrating sub-agents on long tasks. And if you just want a draggable whale widget parked on the edge of your screen for pure entertainment - no numbers, no pressure - it ships with that too.
Screenshots

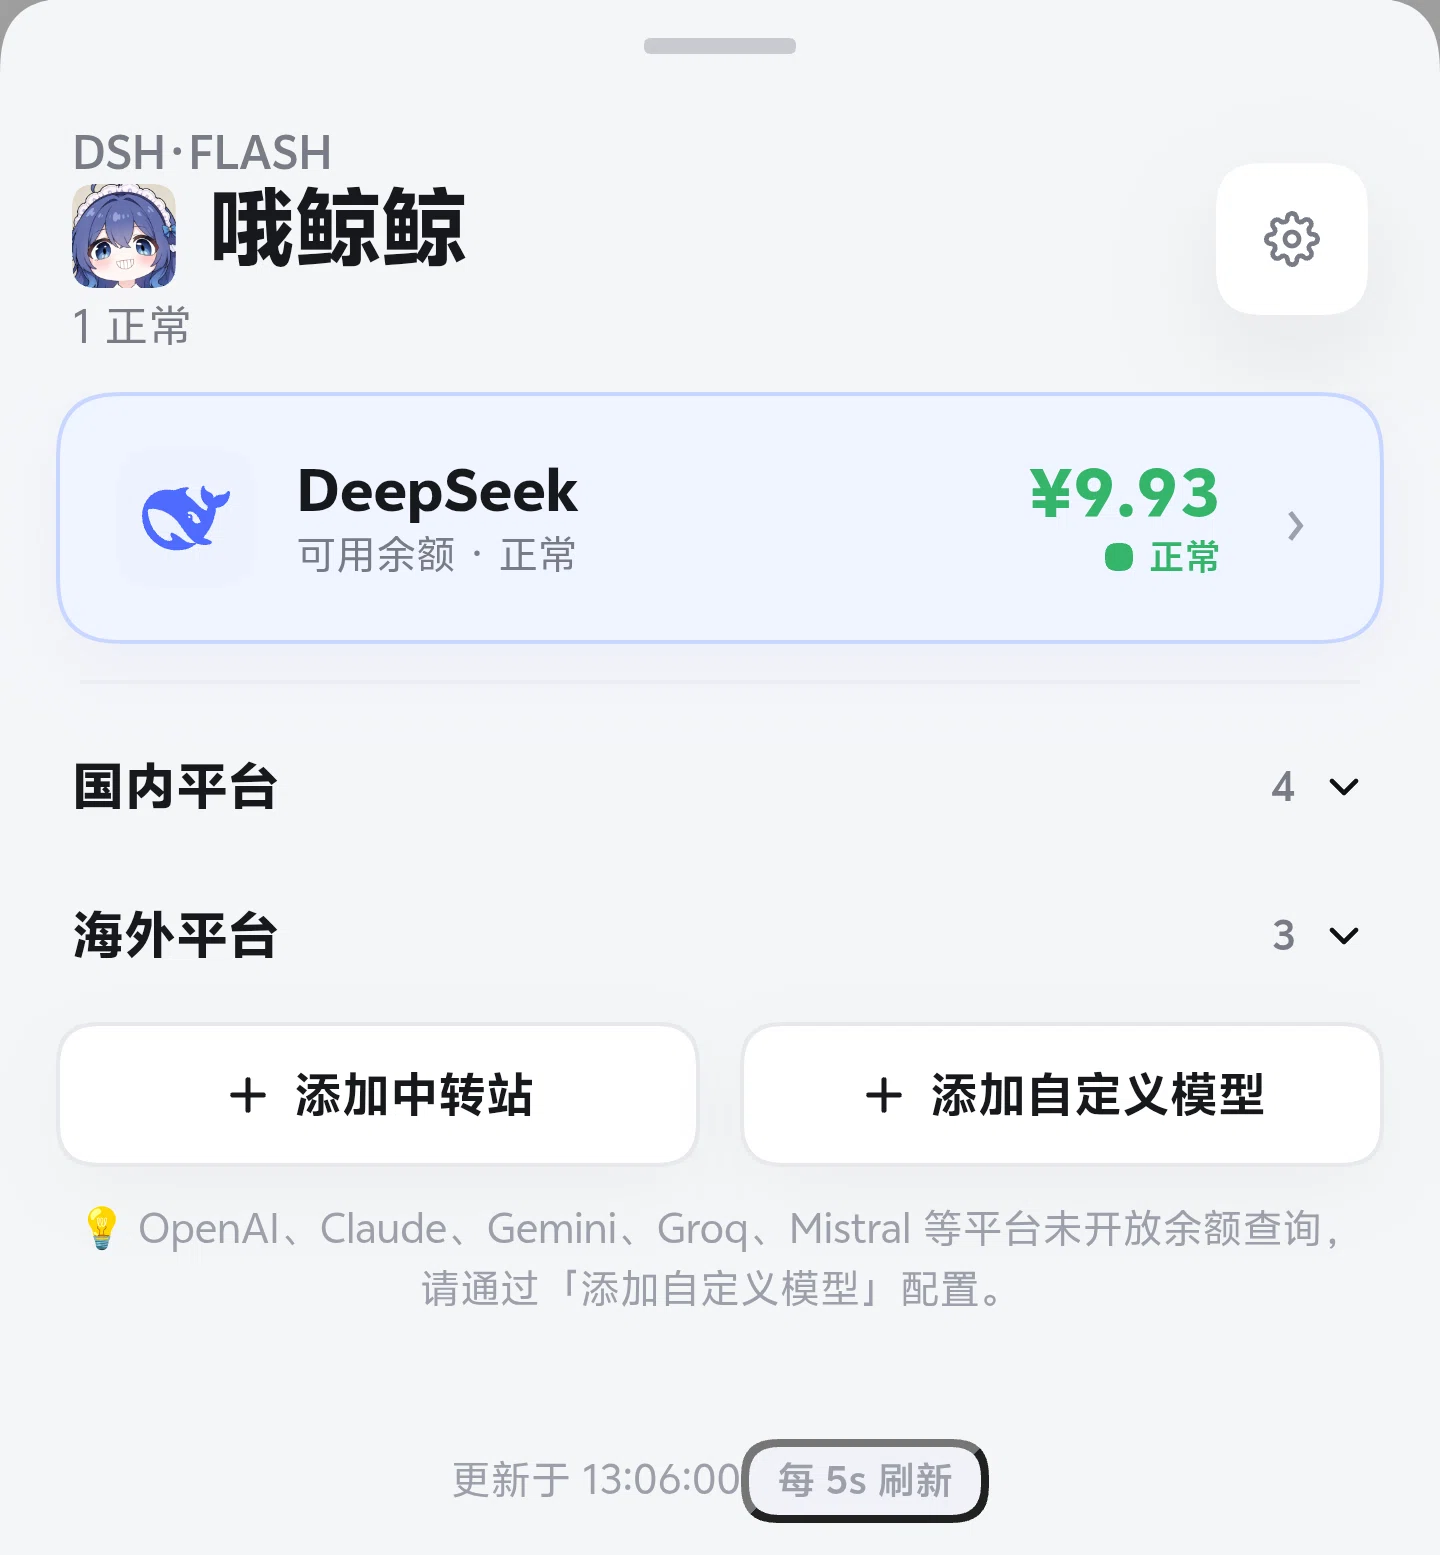
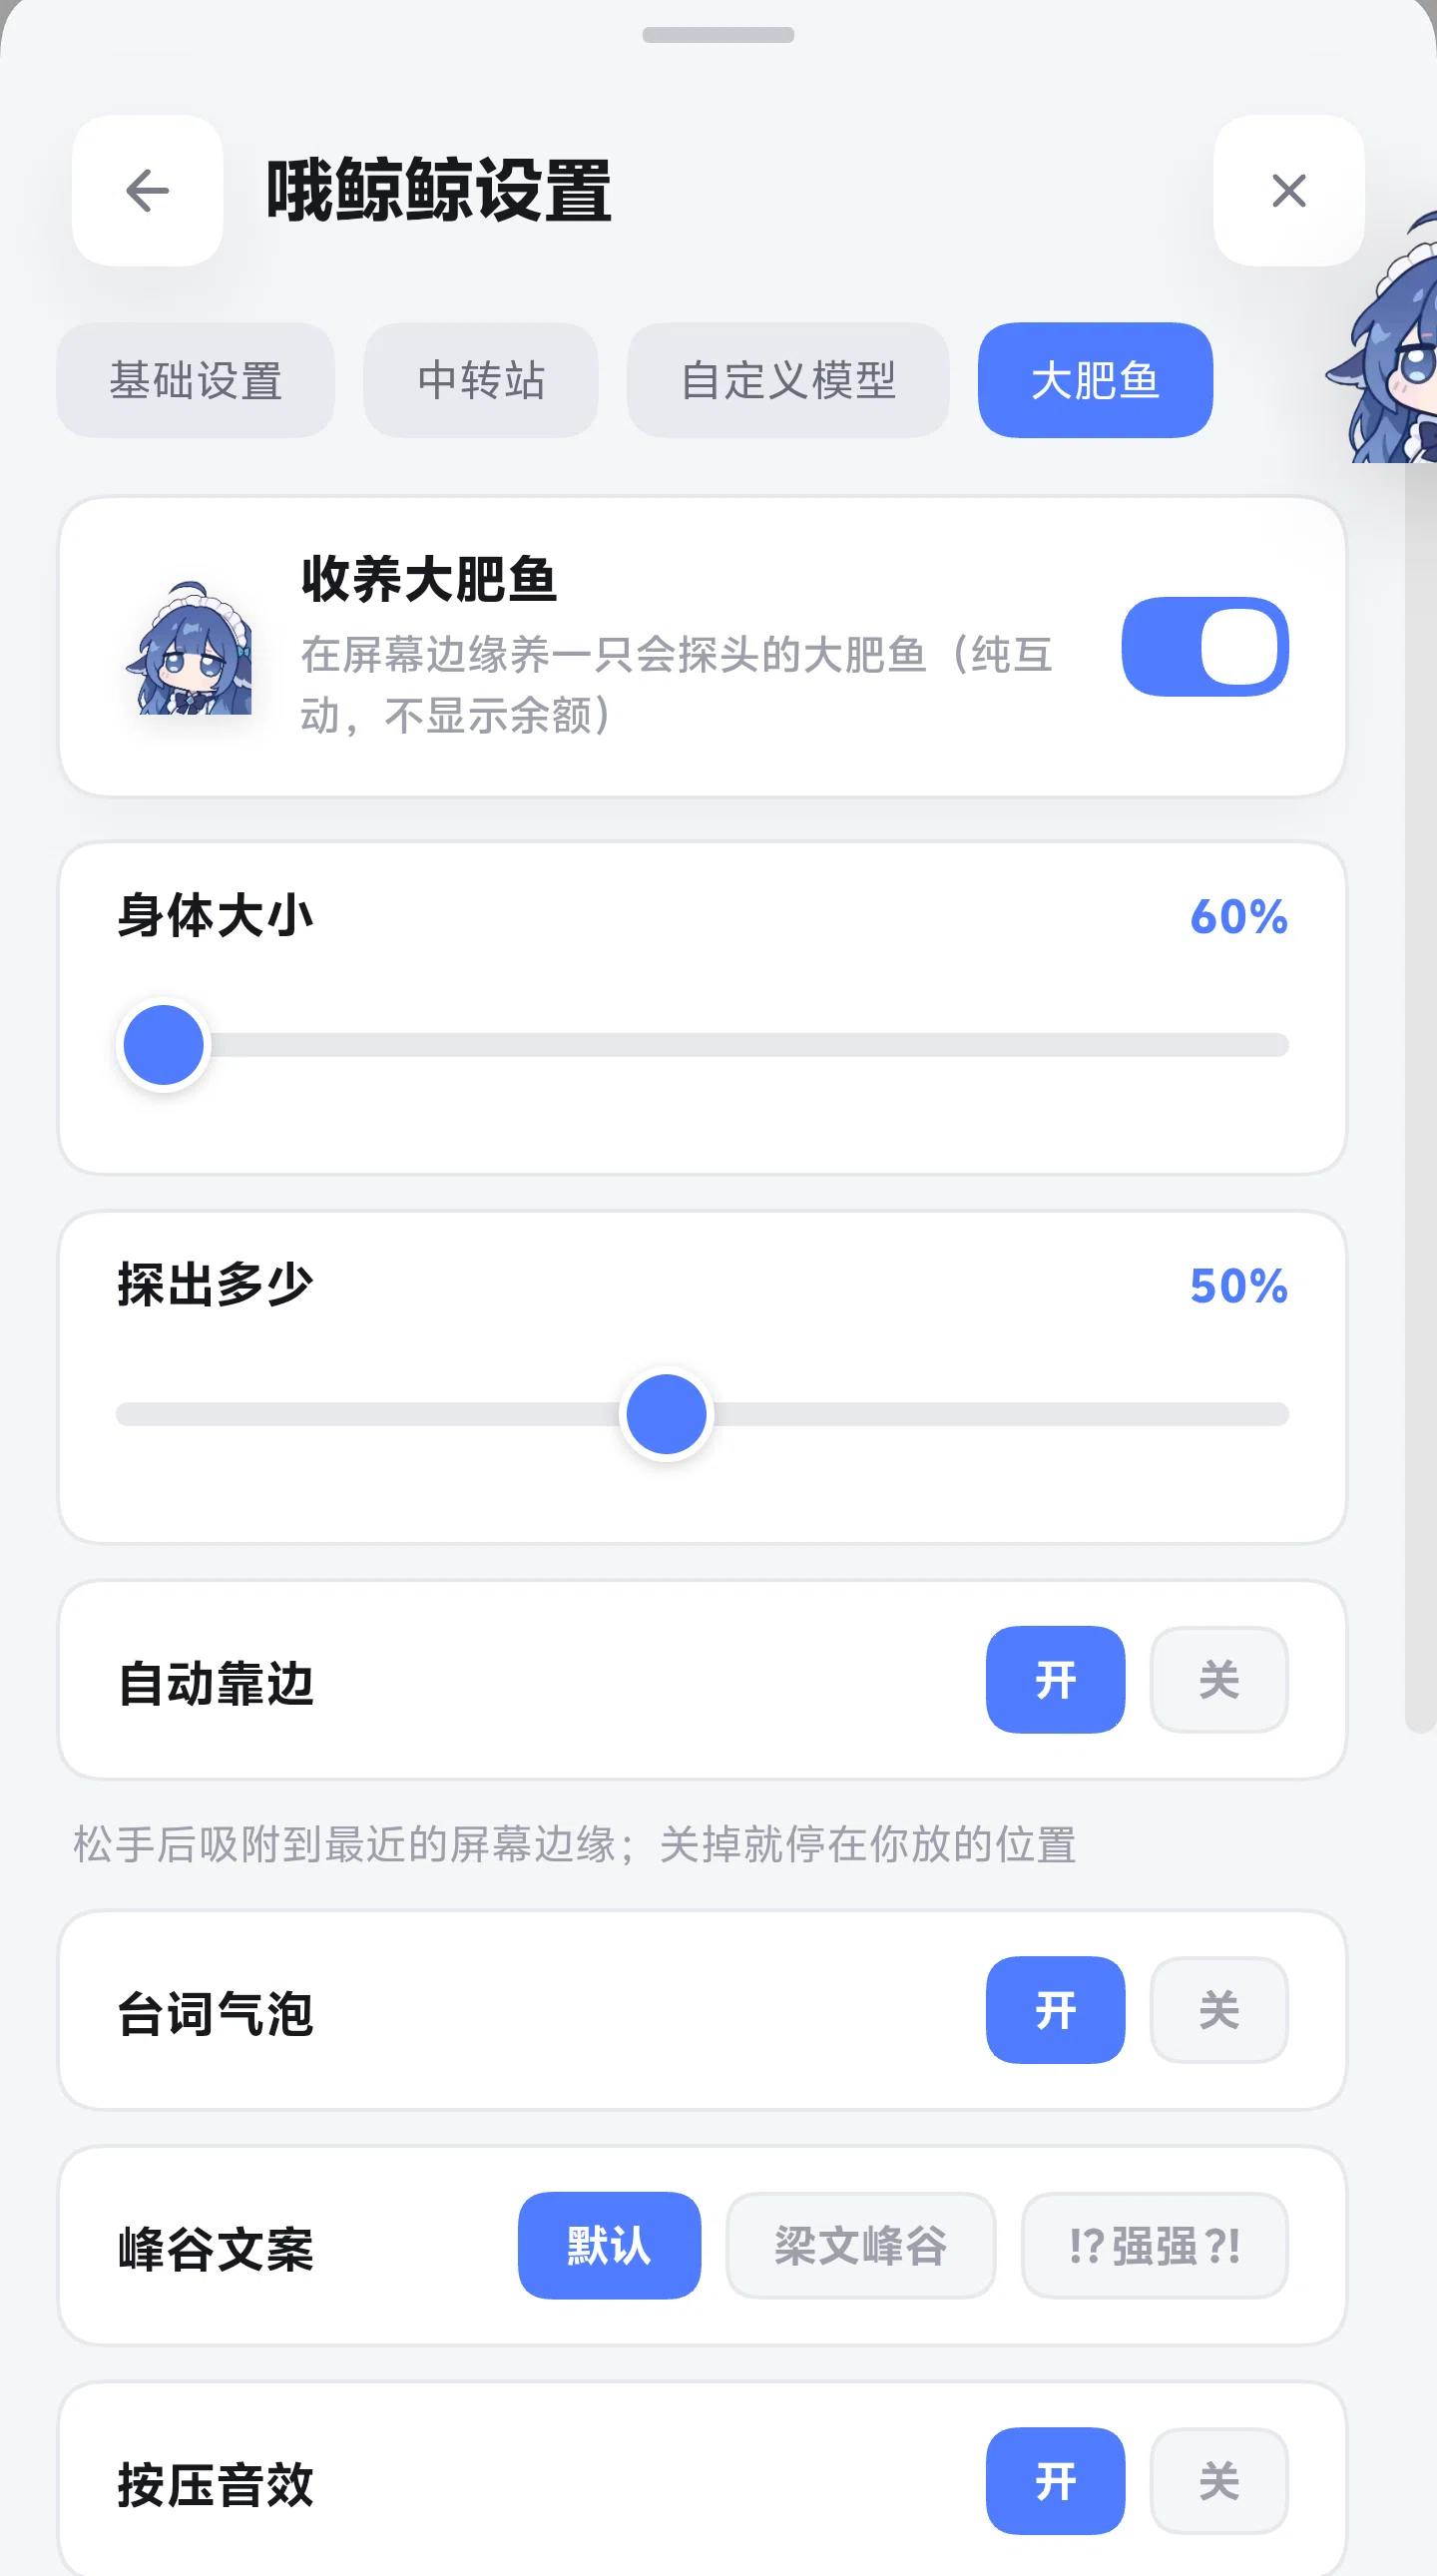
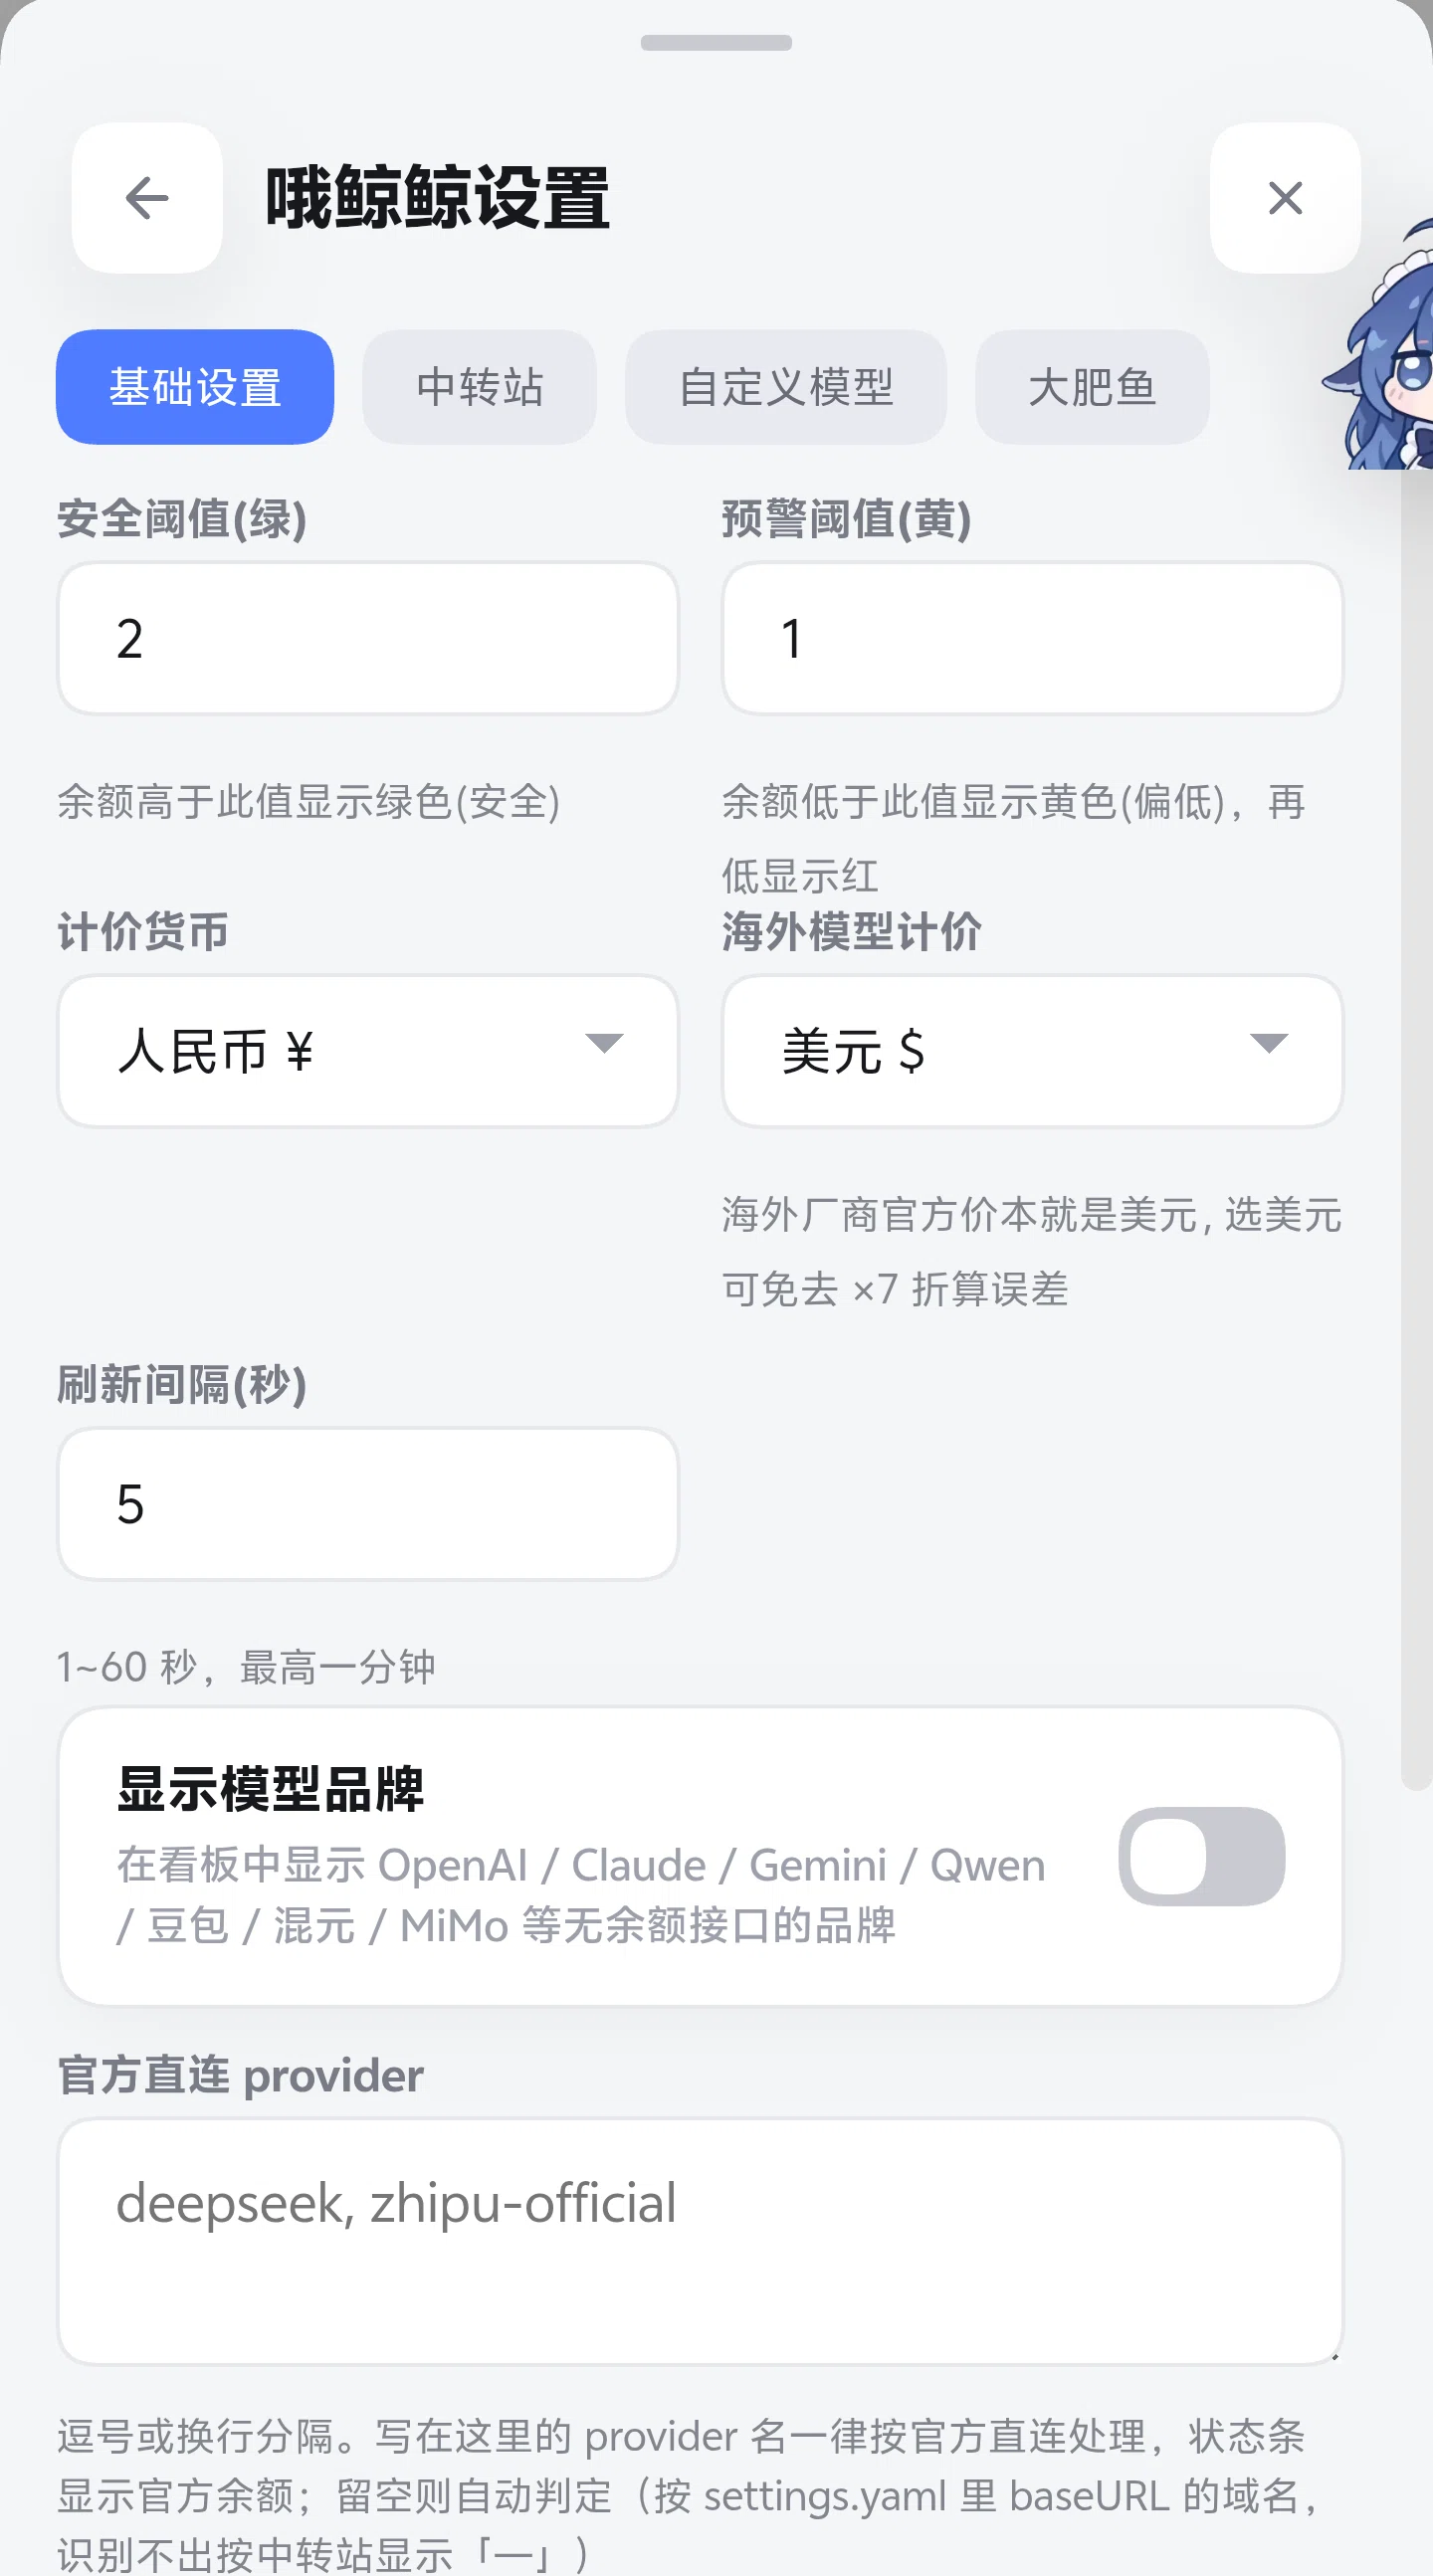
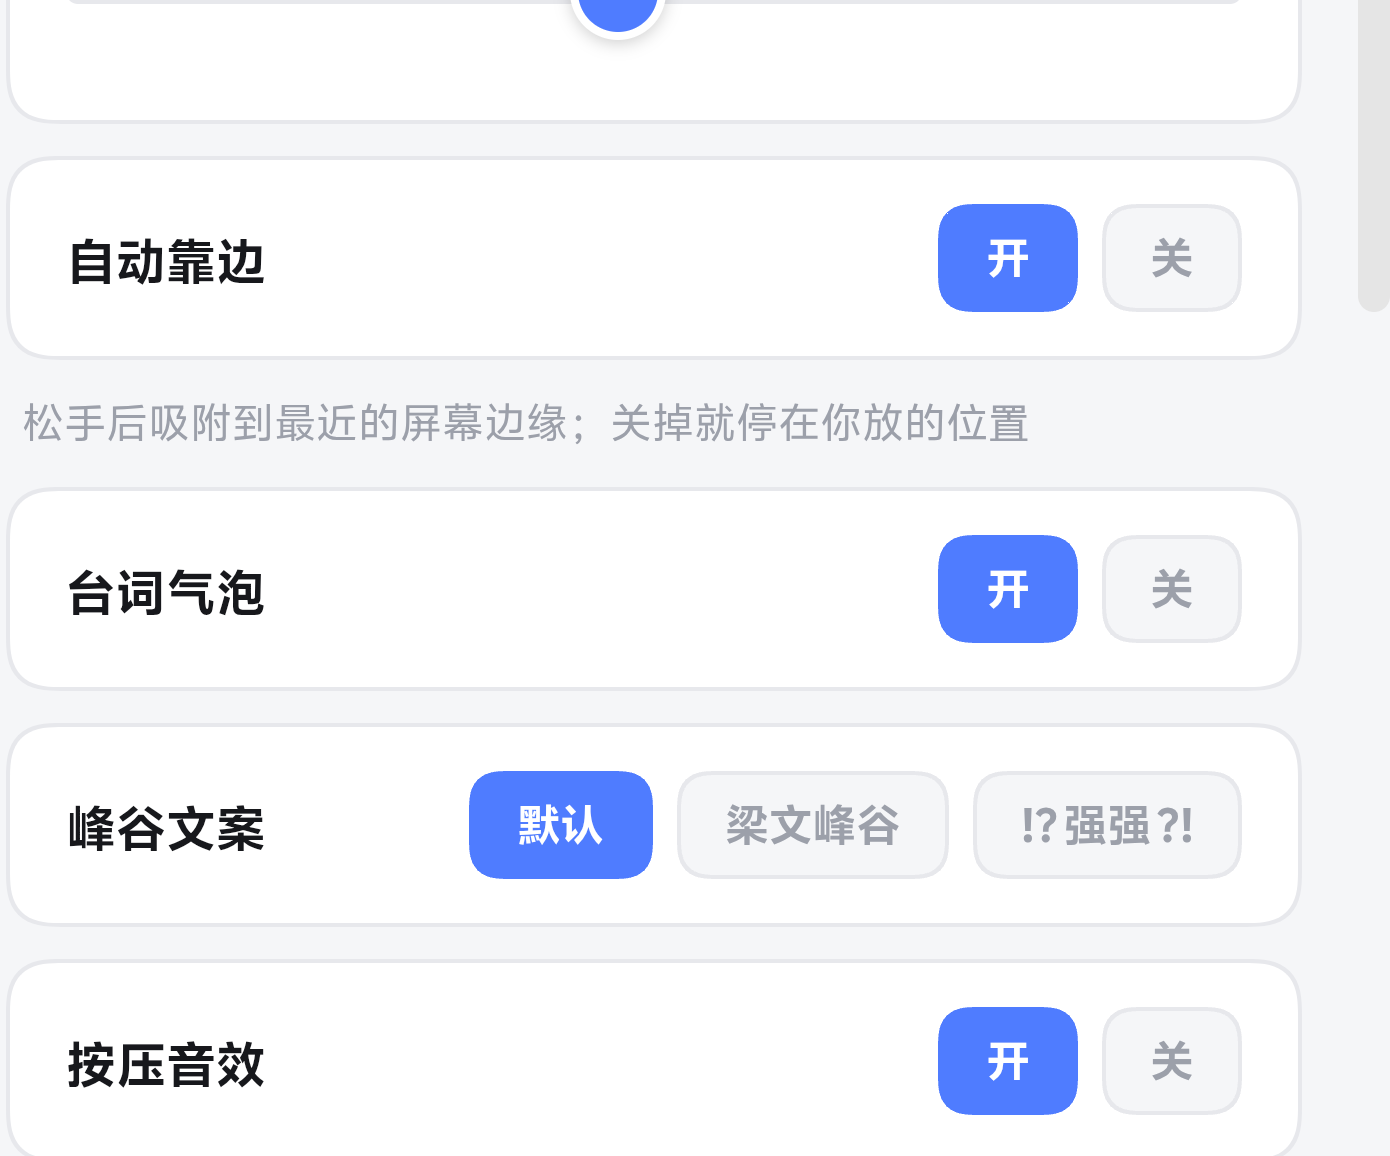
Use Cases
- Quickly check remaining balance and total spend across multiple API providers at a glance
- Track per-sub-agent token cost in real time during long orchestration tasks
- Receive a push alert the moment a platform balance drops below your custom threshold
Best For
- Developers running multiple provider APIs inside DeepSeek Harness
- Users orchestrating sub-agents on long tasks who need a live cost pulse
- Anyone who wants a draggable whale widget on the screen edge for pure desk fun
Related Plugins
A service-oriented sidebar framework for DSH, offering a full workbench with file explorer, embedded browser, real terminal, Git panel, and extensible plugin services.

A beautiful, practical Claude Code-style TUI plugin with pixel whale top bar, flowing glow title, real-time status line, streaming thought expansion, time rewind, context progress bar and TPS gauge — zero core changes.

The plugin market for DeepSeek Harness: browse/search/one-click install community plugins and themes, with updates, backup/restore, hot disable, diagnostics, and AI fix.

A persistent whale widget on the DSH web UI that shows DeepSeek balance, today's usage, and per-turn cost, with drag-and-snap and sound effects.