dsh-usage-board
Run the following command in DeepSeek Harness:
dsh plugin install zhm20001/dsh-usage-board
Paste the following prompt into your AI chat to install this plugin:
Run dsh plugin install zhm20001/dsh-usage-board in your DeepSeek Harness terminal to install the plugin; the full source code is available at https://github.com/zhm20001/dsh-usage-board .
About this plugin
Running multi-turn conversations or orchestrating multiple sub-agents in DeepSeek Harness means tokens are constantly flying, yet figuring out how much went to thinking vs. content, what the cache hit rate was, or how much the nightly tier actually saved you is usually a scavenger hunt through raw jsonl files. dsh-usage-board exists to eliminate that blind spot: it treats the DSH session files as a read-only source of truth, builds a locally rebuildable SQLite projection using Node.js 22.5+ native node:sqlite, with zero C++ compilation and zero Worker overhead. A one-time cold-start sweep covers all historical sessions, and from then on it tracks increments, with every computation staying local.
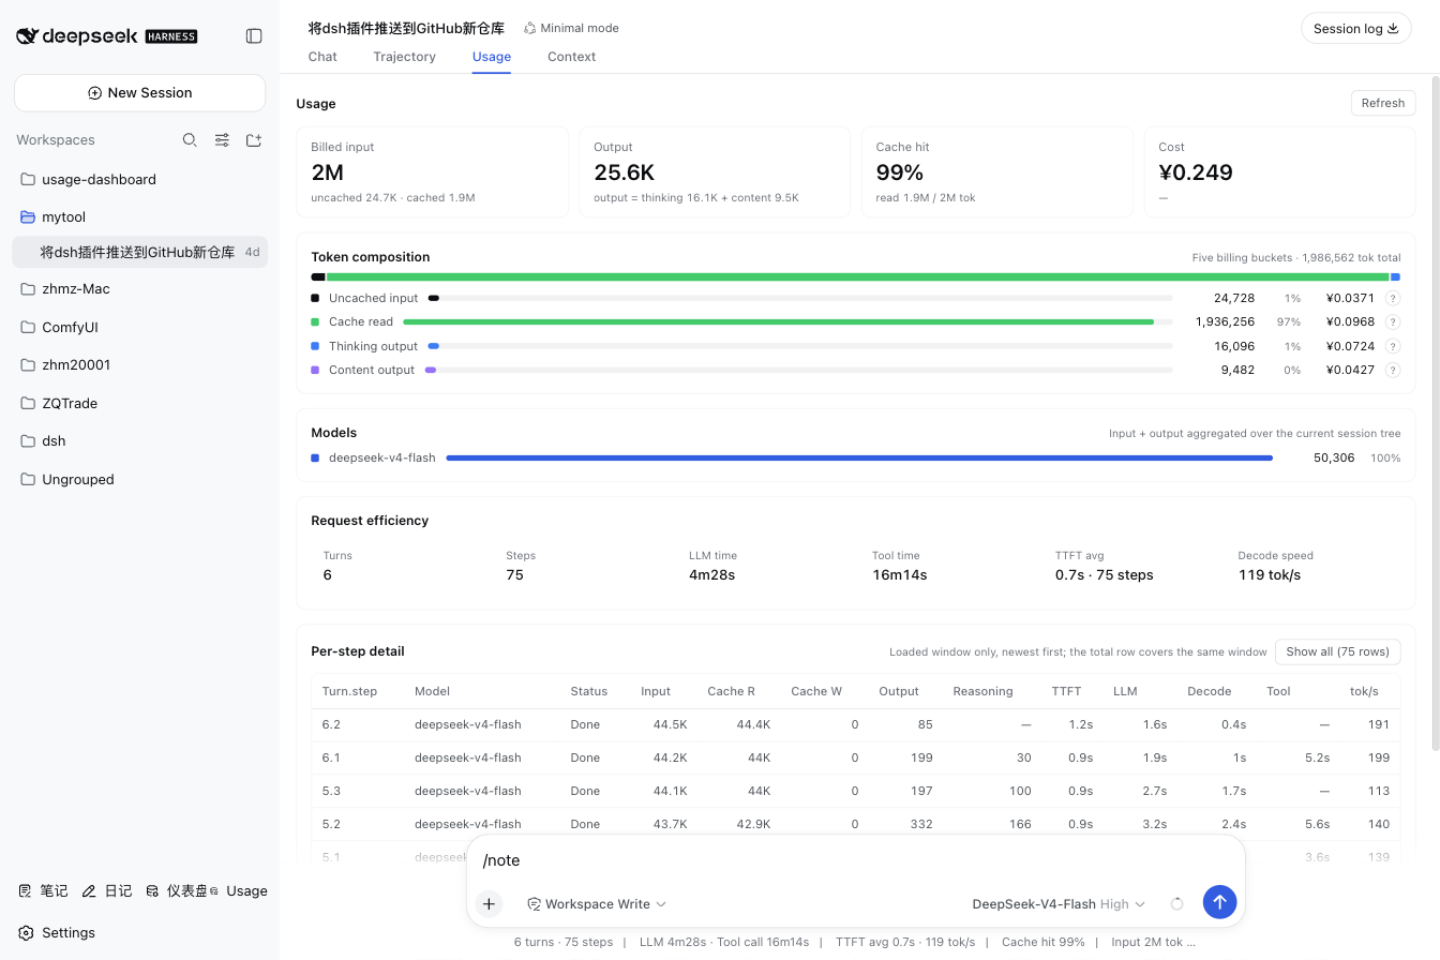
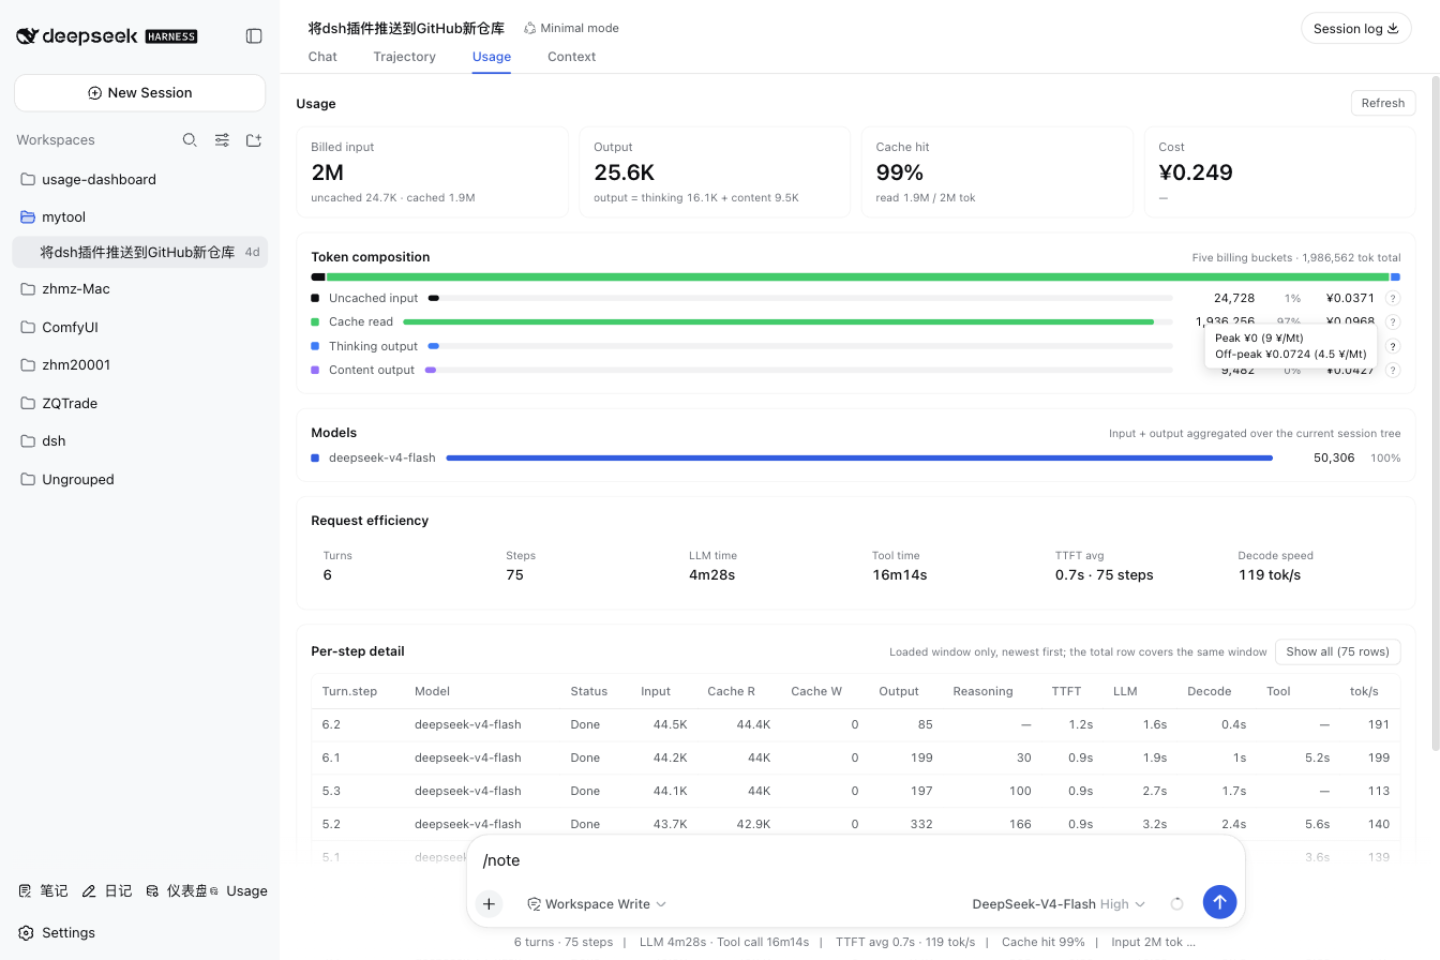
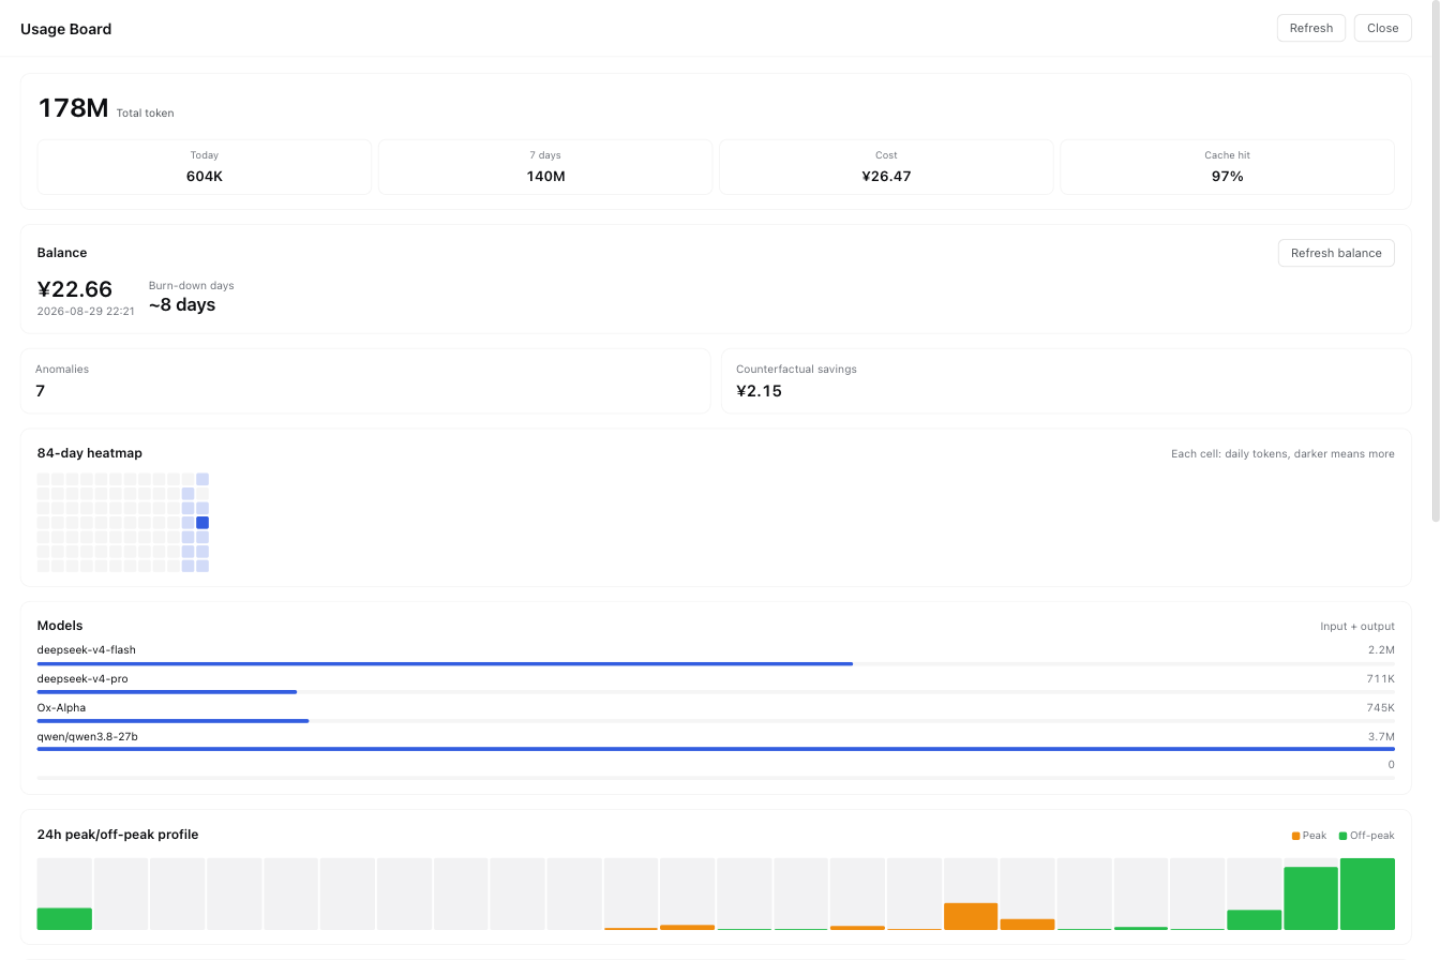
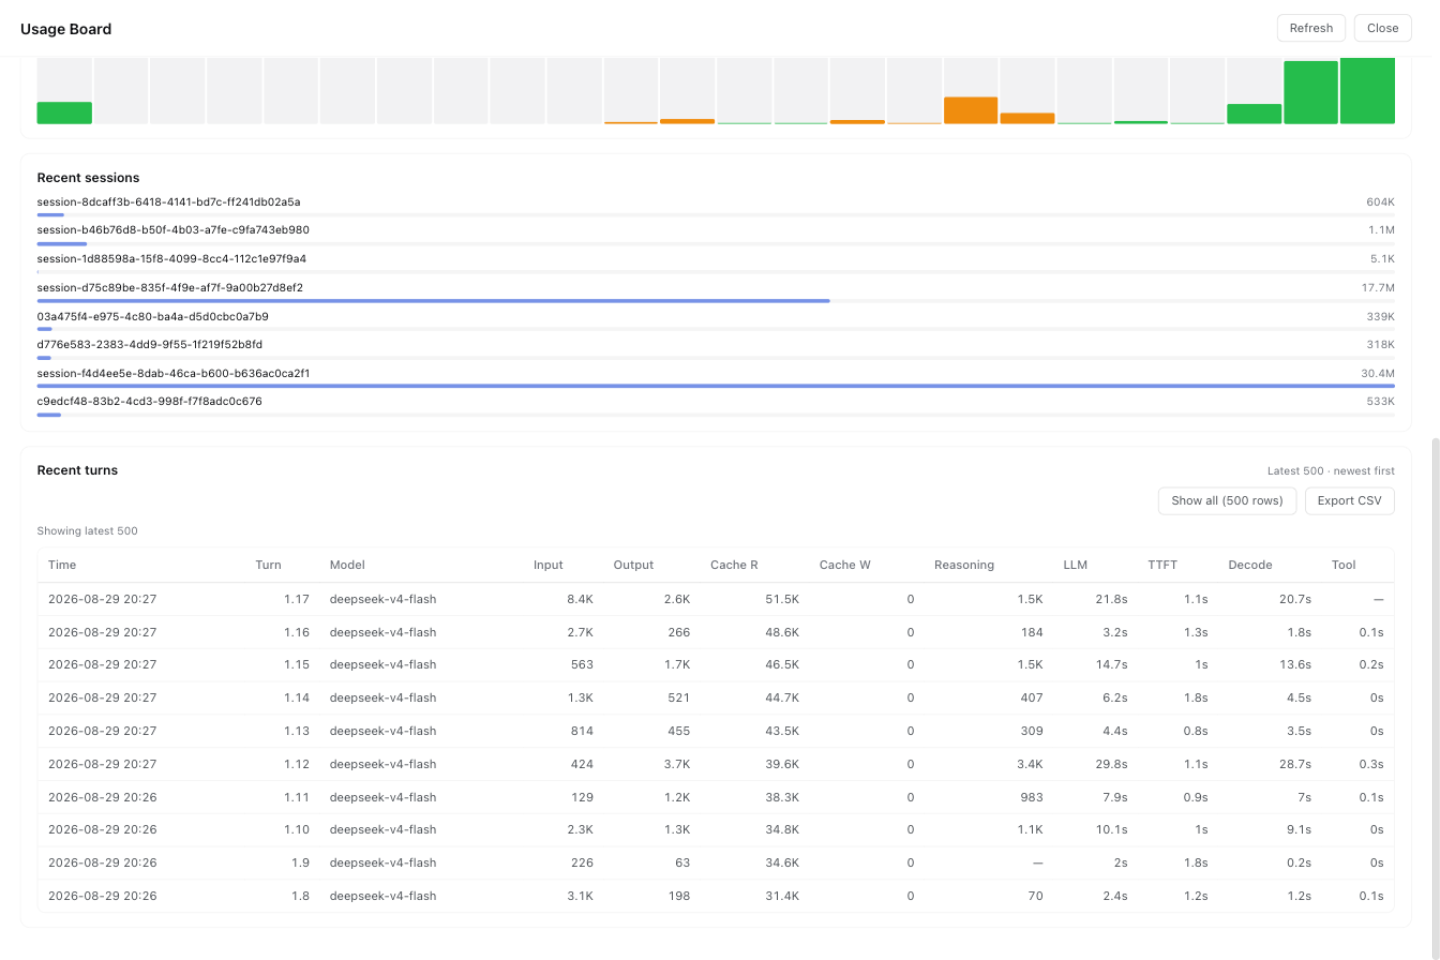
The dashboard mounts seamlessly into three host slots. A Usage tab on the conversation detail page breaks down the token five-bucket composition, peak and off-peak unit prices, model share, and a per-step latency waterfall for the current session. A sidebar button opens a full-screen overlay that surfaces balance and days remaining, an 84-day usage heatmap, a 24-hour peak/off-peak profile, and counterfactual savings from the nightly tier. Recent sessions are grouped by Sub-agent DAG call chains, allowing tree-level roll-up and drill-down to Turn-by-Turn, Step-by-Step detail with one-click CSV export. Hovering the question mark on any token bucket reveals the exact peak and off-peak unit prices side by side, so every cent is accounted for.
It is built for developers who run long-lived agent workloads in DSH and need fine-grained budget control over their API spend. A single DEEPSEEK_API_KEY configuration enables real-time balance and burn-rate projections from DeepSeek; without it, all local analytics still work. The projection database can be deleted and rebuilt at any time while the write model remains untouched, keeping maintenance overhead near zero.
Screenshots
Use Cases
- Real-time tracking of token consumption, step latency, and peak/off-peak cost breakdown in multi-turn conversations
- Tree-level roll-up and turn-level drill-down across multi-agent DAG call chains
- Monitoring DeepSeek account balance and burn rate to plan API budget and off-peak savings
Best For
- Developers running long-lived agent workloads in DSH
- Engineering teams that need fine-grained control over multi-model API spend
- DSH users focused on usage-pattern analytics and cost optimization
Related Plugins
A service-oriented sidebar framework for DSH, offering a full workbench with file explorer, embedded browser, real terminal, Git panel, and extensible plugin services.

A beautiful, practical Claude Code-style TUI plugin with pixel whale top bar, flowing glow title, real-time status line, streaming thought expansion, time rewind, context progress bar and TPS gauge — zero core changes.

The plugin market for DeepSeek Harness: browse/search/one-click install community plugins and themes, with updates, backup/restore, hot disable, diagnostics, and AI fix.

A persistent whale widget on the DSH web UI that shows DeepSeek balance, today's usage, and per-turn cost, with drag-and-snap and sound effects.