dsh-plugin-token-heatmap
Run the following command in DeepSeek Harness:
dsh plugin install P-CAmilE/dsh-plugin-token-heatmap
Paste the following prompt into your AI chat to install this plugin:
Run dsh plugin install P-CAmilE/dsh-plugin-token-heatmap in the DeepSeek Harness terminal (source: https://github.com/P-CAmilE/dsh-plugin-token-heatmap), then restart dsh web — a square icon in the lower-right corner confirms a successful install.
About this plugin
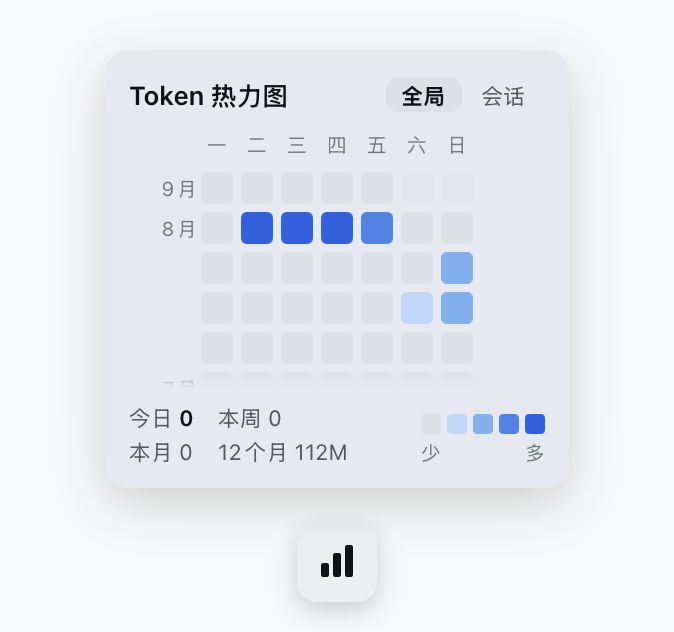
How many Tokens did I burn today? Which days spiked? How much went to input versus output? These numbers are usually buried in individual chat logs with no time-series view to tie them together. dsh-plugin-token-heatmap fills that gap by rendering a vertical 12-month heatmap in the corner of the DeepSeek Harness Web GUI, using a five-level blue scale so daily Token totals are instantly readable at a glance.
The plugin offers two data perspectives — an all-sessions global view and a per-session view — switchable in real time from a floating window. On first launch it automatically backfills the last twelve months by scanning every historical session log, giving you the full picture immediately. After that, data polls every three seconds with version tagging and only repaints when something actually changed. The floating window is draggable, clamps its position within the viewport, remembers visibility and view preferences in localStorage, and adapts to both light and dark themes. Hovering over any date cell reveals a tooltip with input, output, cache-read, and cache-write breakdowns alongside today, weekly, monthly, and 12-month totals.
Whether you are a heavy daily user tracking personal Token spend or a team lead allocating API budget based on usage trends, this heatmap turns scattered numbers into a single glanceable visual. Once installed, a small square icon appears in the lower-right corner; the first-backfill runs silently in the background without blocking everyday use.
Screenshots
Use Cases
- Quickly review daily Token consumption trends and spot peak days
- Compare global totals with per-session usage to trace cost sources
- Reference twelve-month heatmap data when allocating API budgets
Best For
- Individual developers who heavily use DeepSeek Harness
- Tech leads responsible for tracking Token costs
- Active users of the DeepSeek Harness Web GUI
Related Plugins
A service-oriented sidebar framework for DSH, offering a full workbench with file explorer, embedded browser, real terminal, Git panel, and extensible plugin services.

A beautiful, practical Claude Code-style TUI plugin with pixel whale top bar, flowing glow title, real-time status line, streaming thought expansion, time rewind, context progress bar and TPS gauge — zero core changes.

The plugin market for DeepSeek Harness: browse/search/one-click install community plugins and themes, with updates, backup/restore, hot disable, diagnostics, and AI fix.

A persistent whale widget on the DSH web UI that shows DeepSeek balance, today's usage, and per-turn cost, with drag-and-snap and sound effects.