dsh-telemetry
Run the following command in DeepSeek Harness:
dsh plugin install duyanta123/dsh-telemetry
Paste the following prompt into your AI chat to install this plugin:
Run dsh plugin install duyanta123/dsh-telemetry in DeepSeek Harness to install; full source at https://github.com/duyanta123/dsh-telemetry.
About this plugin
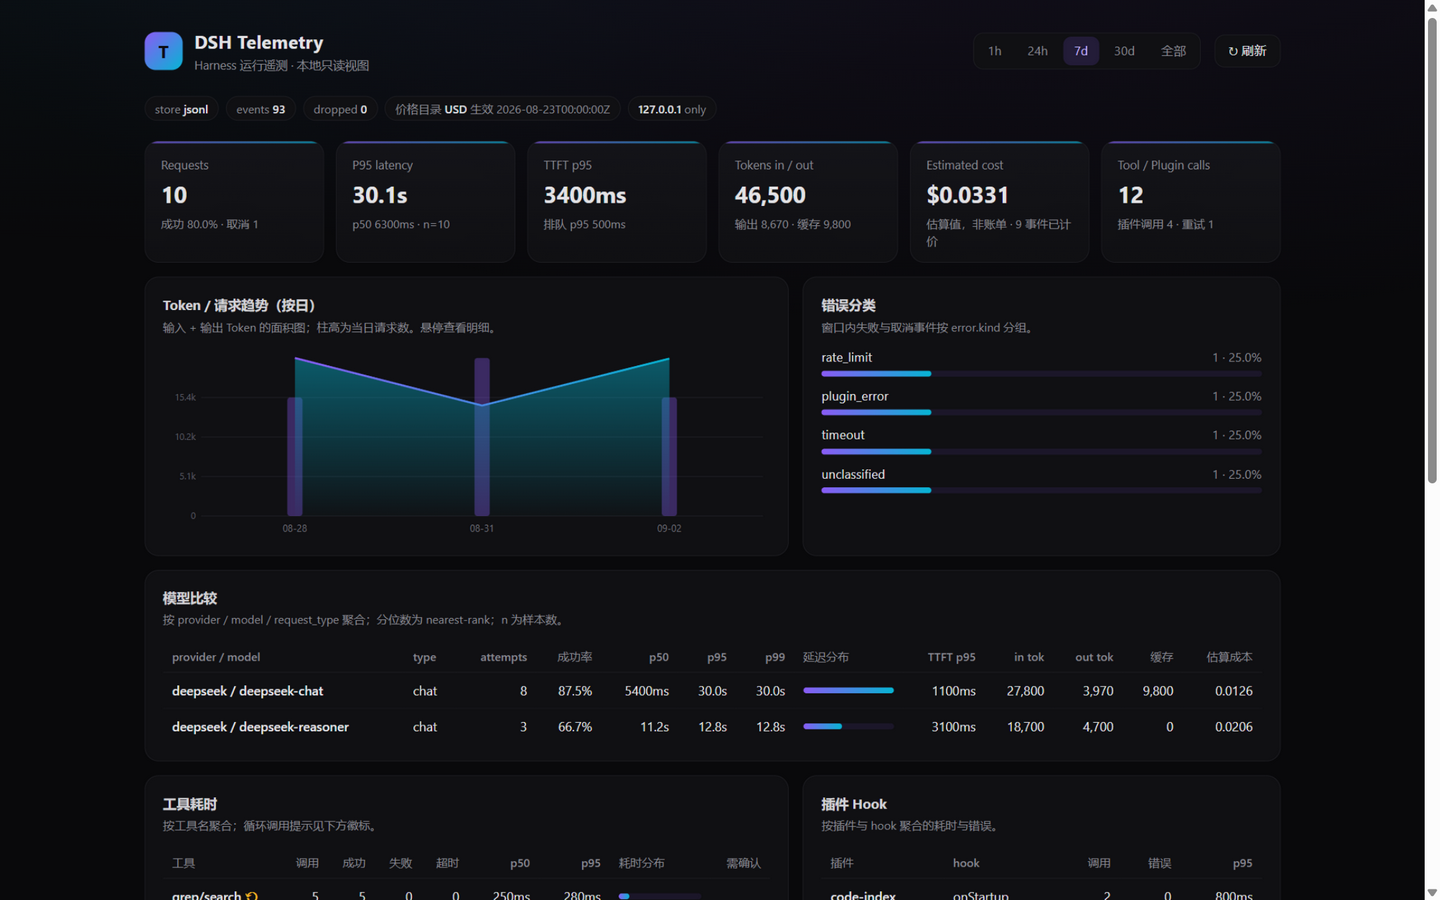
Running a multi-model, multi-plugin Harness stack raises one question over and over: where did the time and the money actually go? dsh-telemetry answers it by bolting a local-first telemetry layer onto every request, model call, tool invocation, and plugin hook in the pipeline. For each attempt it records latency, input and output token counts, retried-call overhead, estimated cost (when a pricing catalog is configured), error classification, and cache-hit statistics. Storage stays entirely on your machine—date-partitioned JSONL on Node 18+ or optional SQLite on Node 22.5+—with zero network egress.
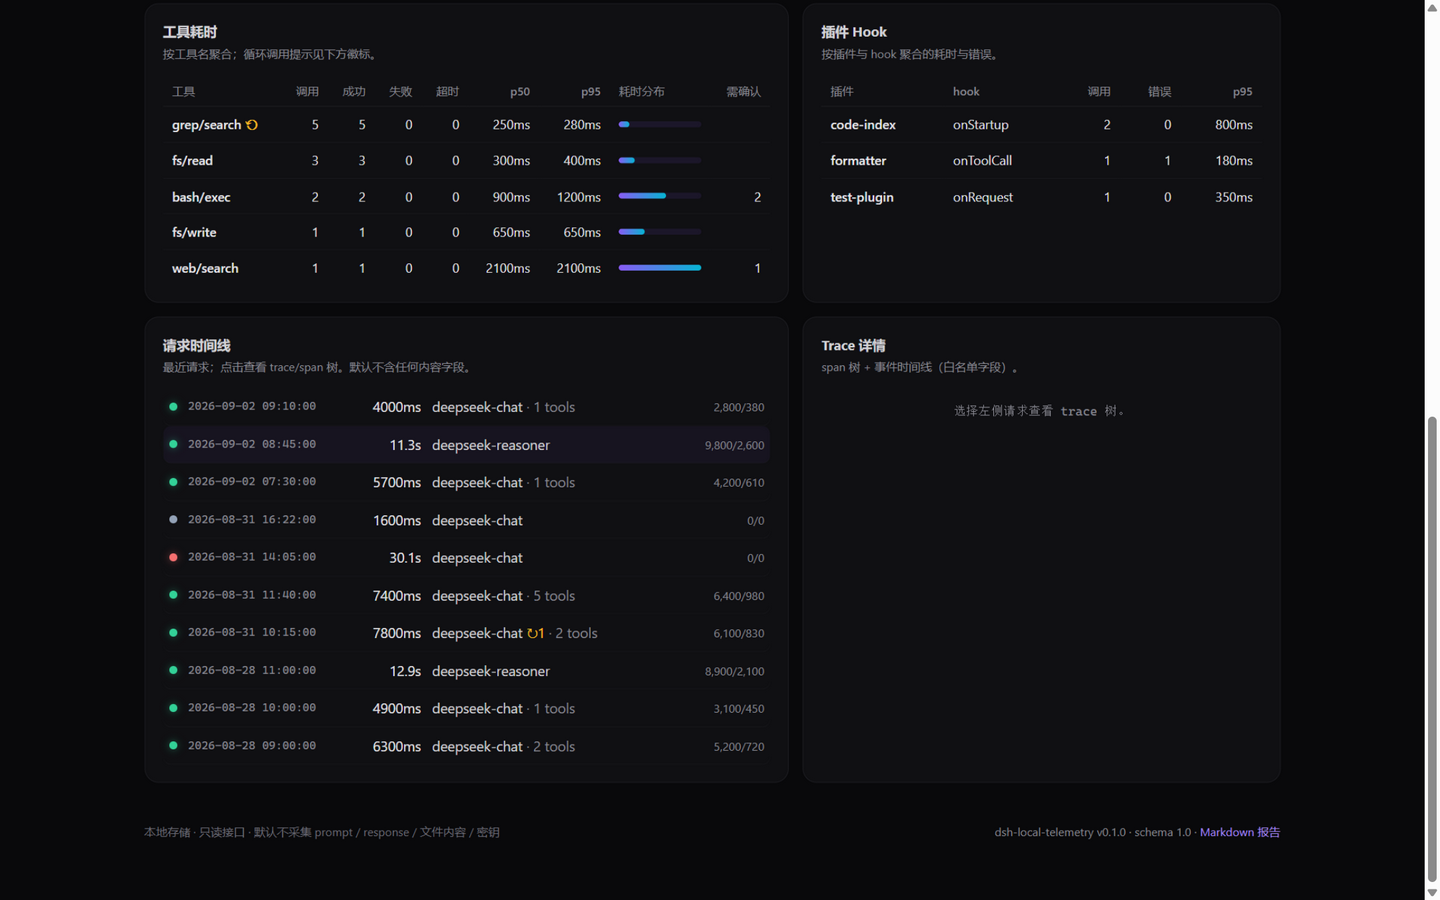
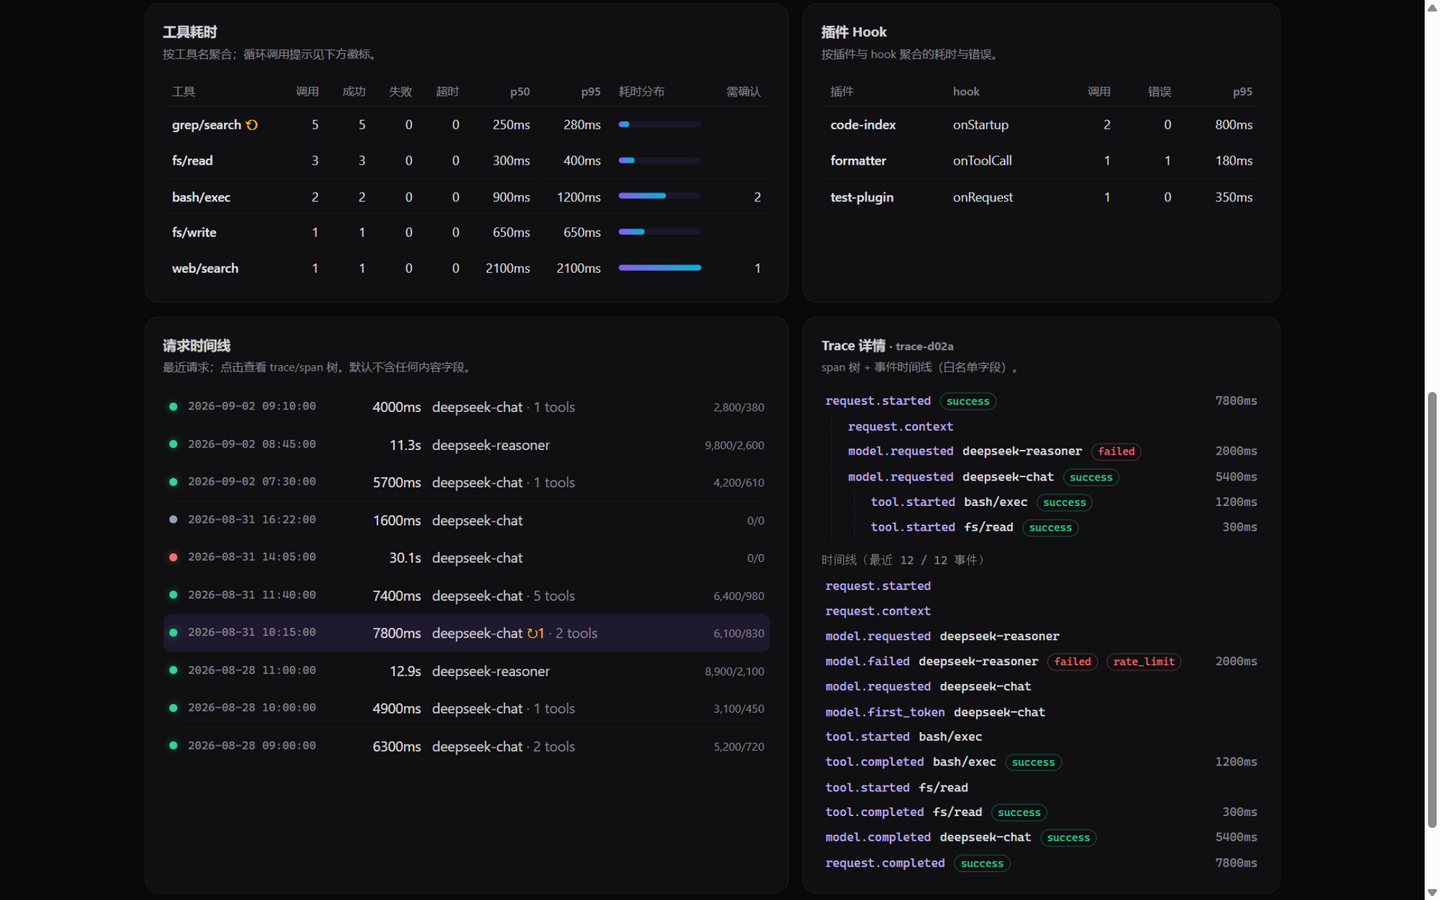
On top of the raw store, a rich CLI lets you filter by time window, group by model, plugin, tool, profile, or day, isolate slow requests or errors, and drill into a trace/span tree where every attempt (including rate-limit fallbacks) is timed independently. A read-only Web UI, bound strictly to 127.0.0.1, puts P95 latency, time-to-first-token, cost estimates, and error breakdowns on a single screen, each metric annotated with its sample count and recomputable from the underlying events. Privacy is handled by omission: prompts, responses, file contents, command arguments, and secrets are never captured by default; sensitive headers are dropped whole, URL credentials are redacted, and tool, plugin, model, and profile names support stable-but-non-reversible hashing.
It is built for developers and teams operating multi-model, multi-plugin DSH Harness stacks who want quantified visibility into latency percentiles, cost allocation, and failure patterns without shipping conversation data to a third party. It is also a practical auditing tool for catching circular tool calls, diagnosing abnormal retry loops, and pinpointing which plugin hooks are most likely to block or error.
Screenshots
Use Cases
- Tracing latency and cost bottlenecks across each stage of a multi-model Harness run
- Auditing tool-call timeouts and plugin hook failures
- Quantifying cache-hit rates and model-routing cost savings
Best For
- Dev teams operating multi-model, multi-plugin DSH Harness stacks
- Privacy-sensitive users who need local observability without uploading conversations
- SRE or ops engineers debugging circular tool calls and abnormal retry loops
Related Plugins
A service-oriented sidebar framework for DSH, offering a full workbench with file explorer, embedded browser, real terminal, Git panel, and extensible plugin services.

A beautiful, practical Claude Code-style TUI plugin with pixel whale top bar, flowing glow title, real-time status line, streaming thought expansion, time rewind, context progress bar and TPS gauge — zero core changes.

The plugin market for DeepSeek Harness: browse/search/one-click install community plugins and themes, with updates, backup/restore, hot disable, diagnostics, and AI fix.

A persistent whale widget on the DSH web UI that shows DeepSeek balance, today's usage, and per-turn cost, with drag-and-snap and sound effects.