dsh-token-pulse
Run the following command in DeepSeek Harness:
dsh plugin install Hou-DL/dsh-token-pulse
Paste the following prompt into your AI chat to install this plugin:
Run dsh plugin install Hou-DL/dsh-token-pulse in your terminal to install; source code is available at https://github.com/Hou-DL/dsh-token-pulse
About this plugin
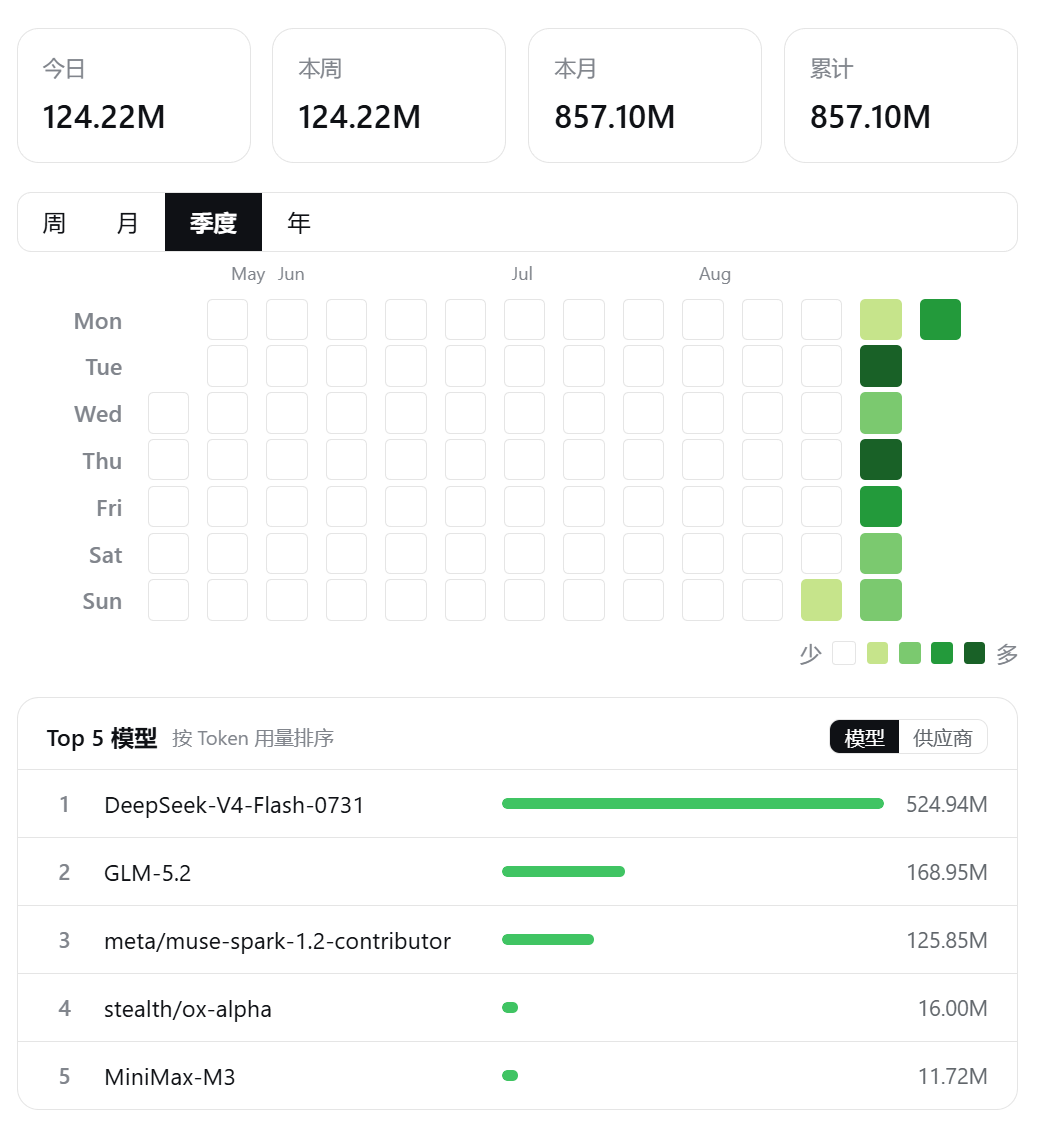
Want to see exactly how many tokens you burn every day, week, or month? dsh-token-pulse turns your local session logs into a GitHub-style usage heatmap, embedded right in the DSH Web settings page. No third-party dashboards, no billing API calls, no network traffic at all.
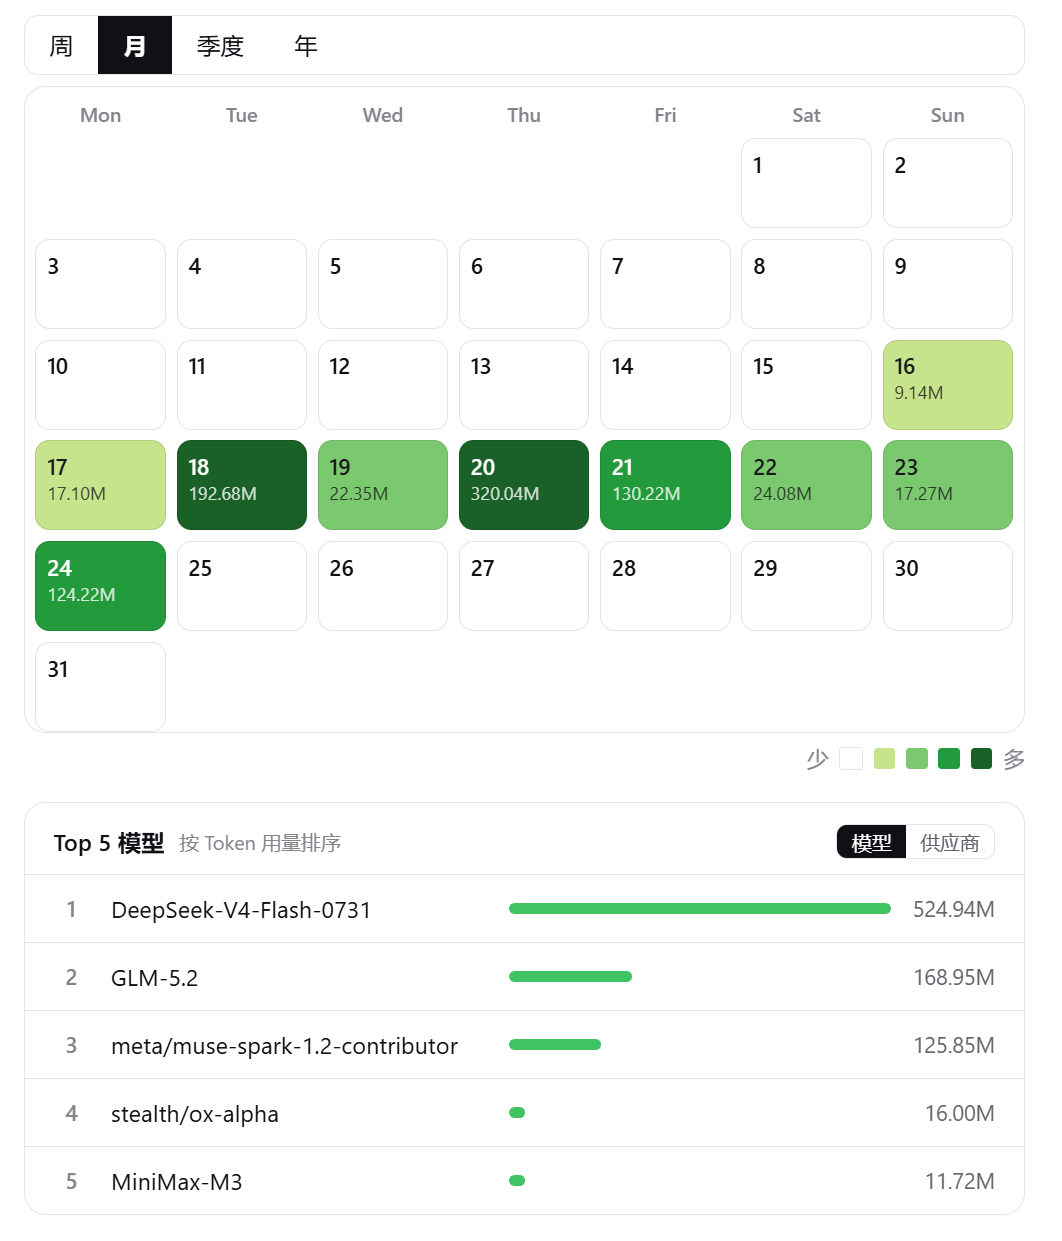
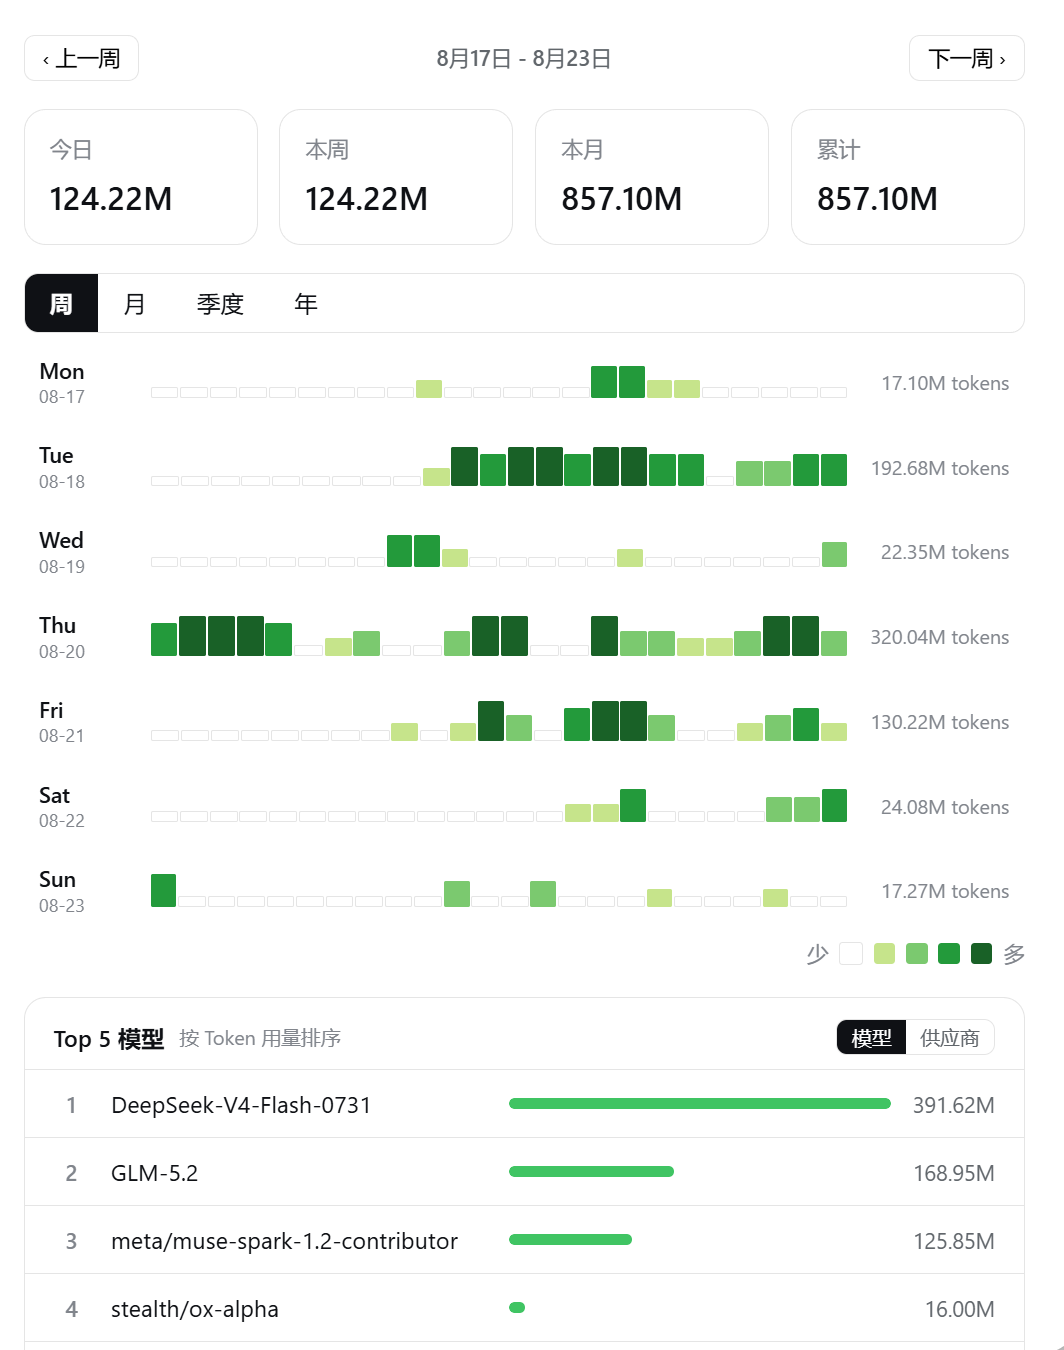
Switch between weekly (24-hour bars), monthly (calendar grid), quarterly (90-day grid), and yearly (two-row annual view), with colour intensity auto-scaled to the quartiles of the current window. A summary strip at the top shows today, this week, this month, and cumulative totals, while a Top-5 panel lets you rank by model or provider and updates as you click any date. Manual refresh or auto-refresh at 5, 10, 30, or 60-minute intervals, plus a Chinese and English toggle, round out the experience.
If you juggle multiple models and providers, want a glanceable sense of peak hours and volume trends, or simply do not want another SaaS tab for what is essentially a local stats chart, dsh-token-pulse is built for you. It requires Node.js 23.8 or later (for built-in zstd decoding) and a running DSH Web instance, with no external dependencies.
Screenshots
Use Cases
- Inspect daily token distribution to spot peak hours at a glance
- Compare consumption across models and providers for informed selection
- Track quarterly and annual trends to support budget planning
Best For
- Developers who frequently switch between models and providers
- Users who prefer offline stats over yet another SaaS tab
- Tech leads who need a cost breakdown to share with the team
Related Plugins
A service-oriented sidebar framework for DSH, offering a full workbench with file explorer, embedded browser, real terminal, Git panel, and extensible plugin services.

A beautiful, practical Claude Code-style TUI plugin with pixel whale top bar, flowing glow title, real-time status line, streaming thought expansion, time rewind, context progress bar and TPS gauge — zero core changes.

The plugin market for DeepSeek Harness: browse/search/one-click install community plugins and themes, with updates, backup/restore, hot disable, diagnostics, and AI fix.

A persistent whale widget on the DSH web UI that shows DeepSeek balance, today's usage, and per-turn cost, with drag-and-snap and sound effects.