dsh-all-usage
Run the following command in DeepSeek Harness:
dsh plugin install ParticleLight/dsh-all-usage
Paste the following prompt into your AI chat to install this plugin:
Run dsh plugin install ParticleLight/dsh-all-usage in DeepSeek Harness to install; source is available at https://github.com/ParticleLight/dsh-all-usage
About this plugin
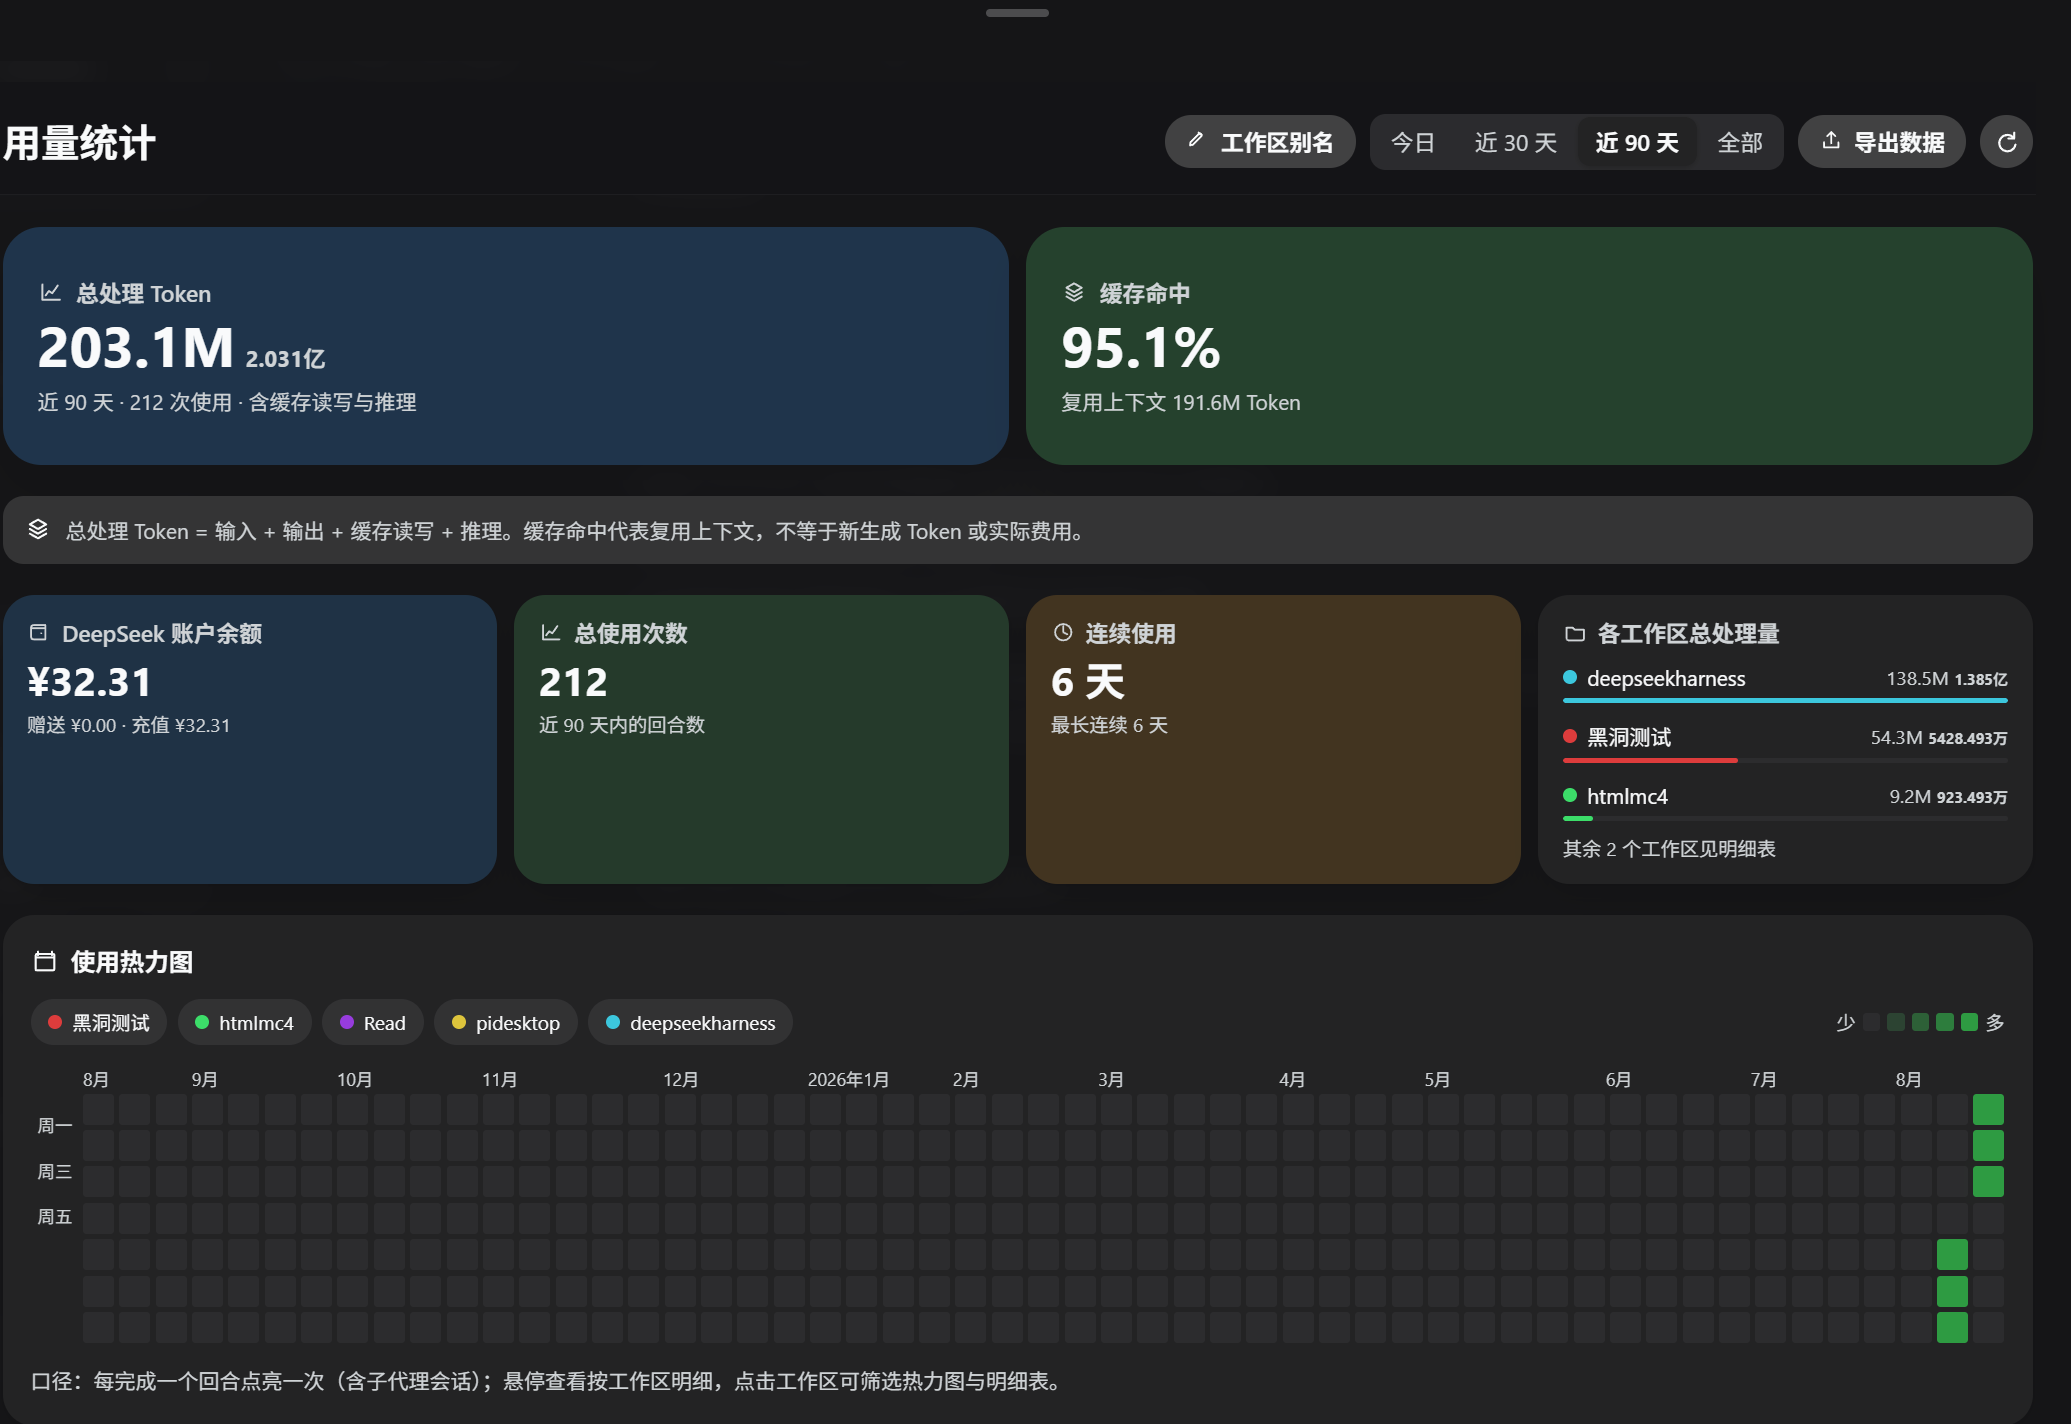
After a few months on DeepSeek Harness, you will likely hit the same wall: you want to know how many tokens you actually burned, whether the cache is doing any real work, and which workspace or model drives the spend, but the answers are buried in scattered session logs. dsh-all-usage turns that digging into a single sidebar dashboard you can open and read.
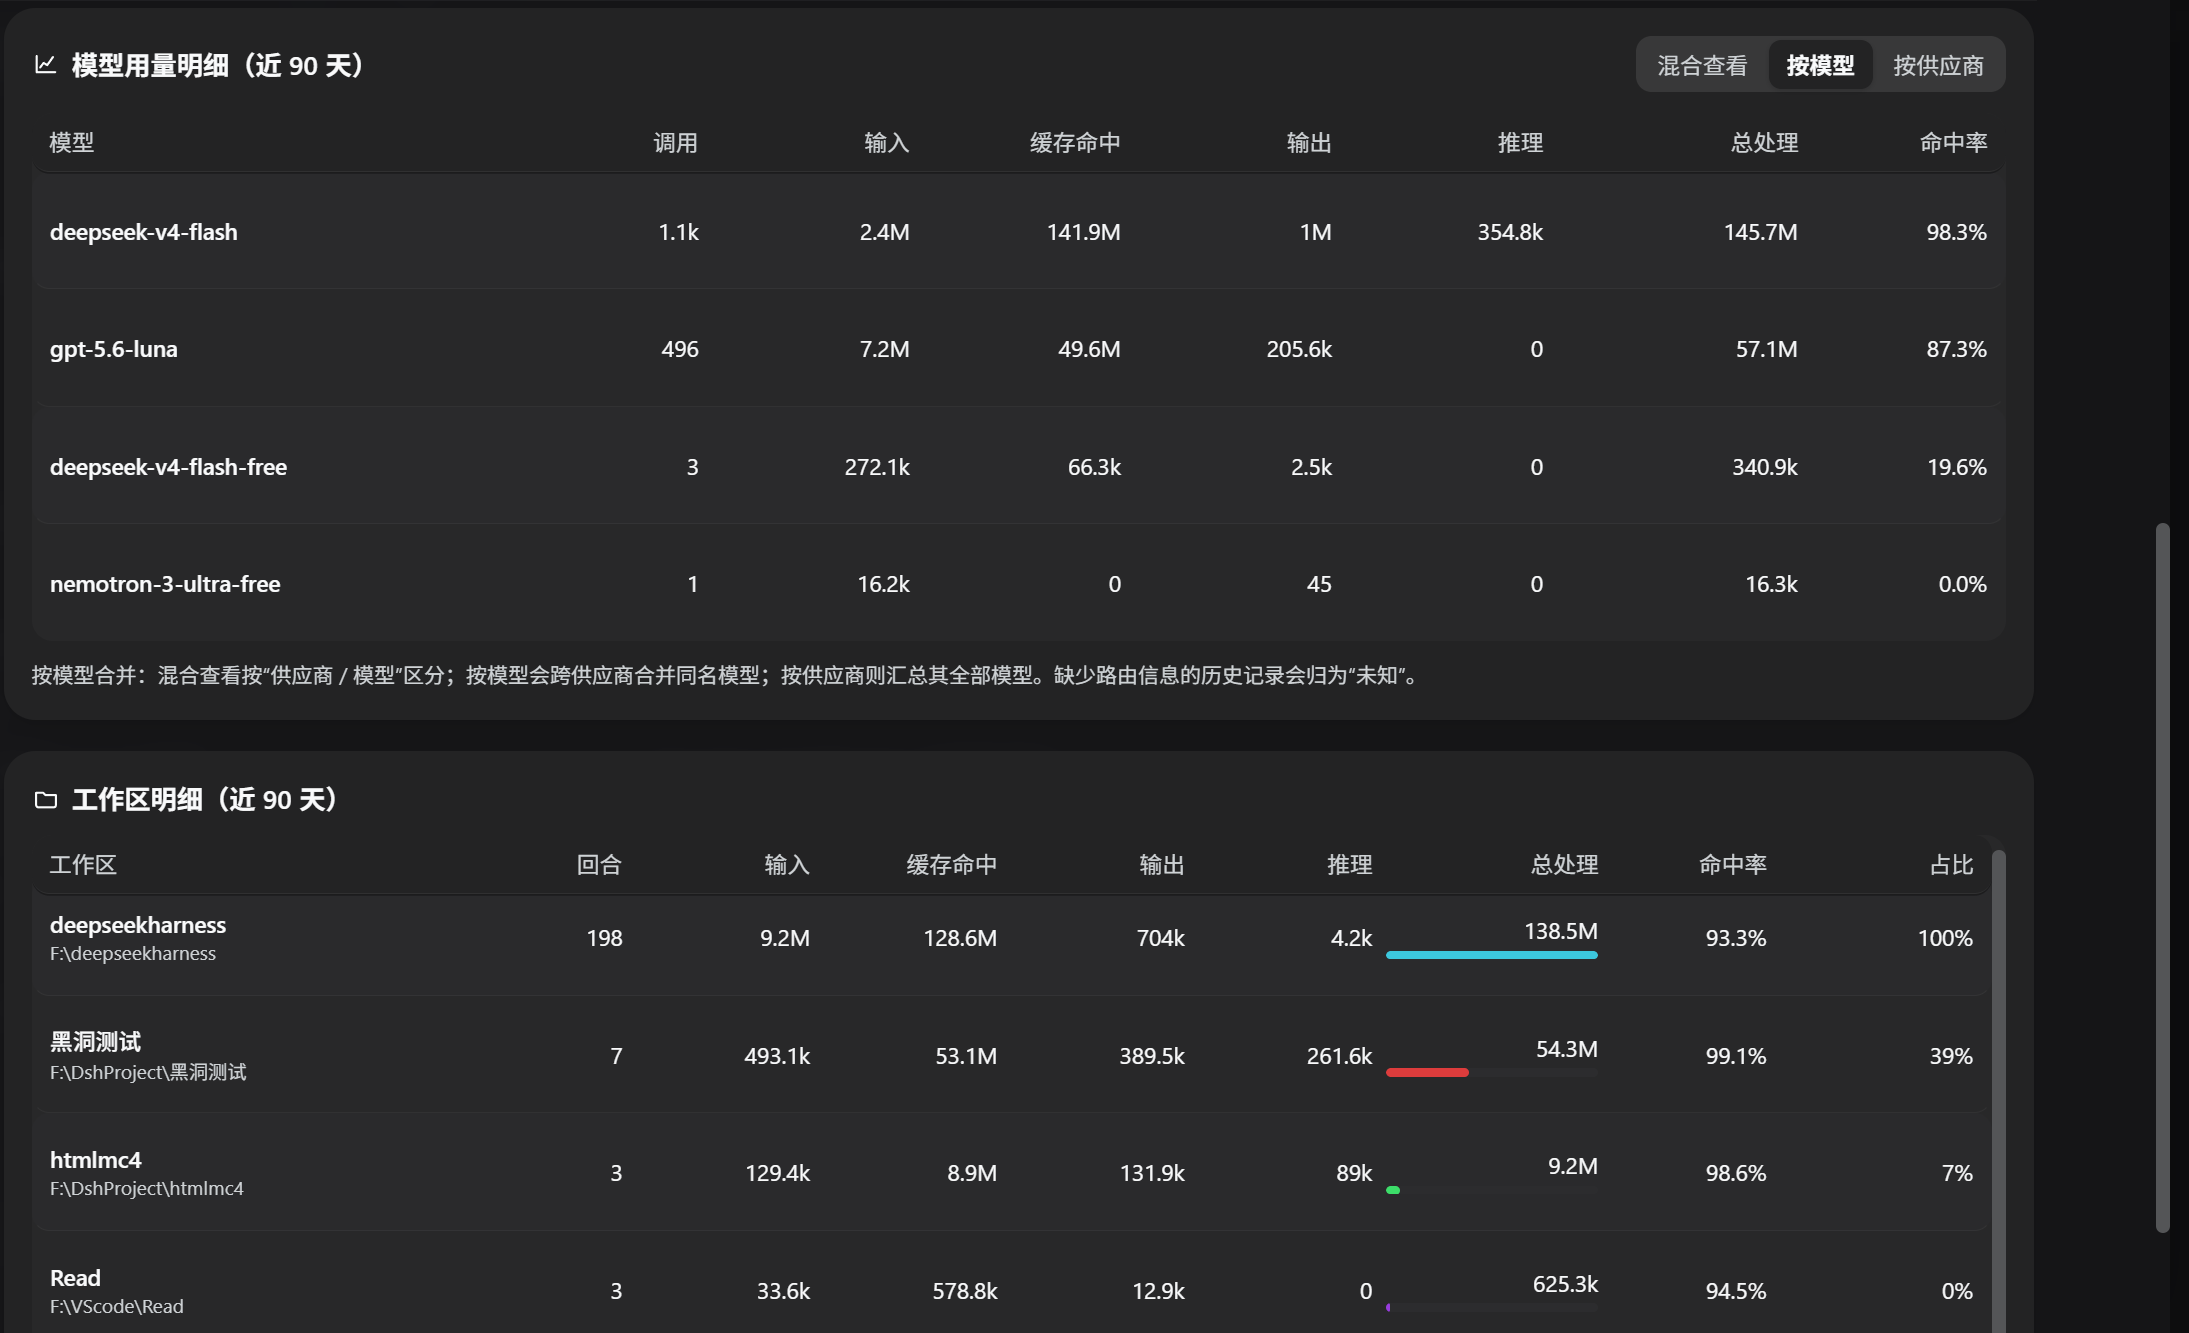
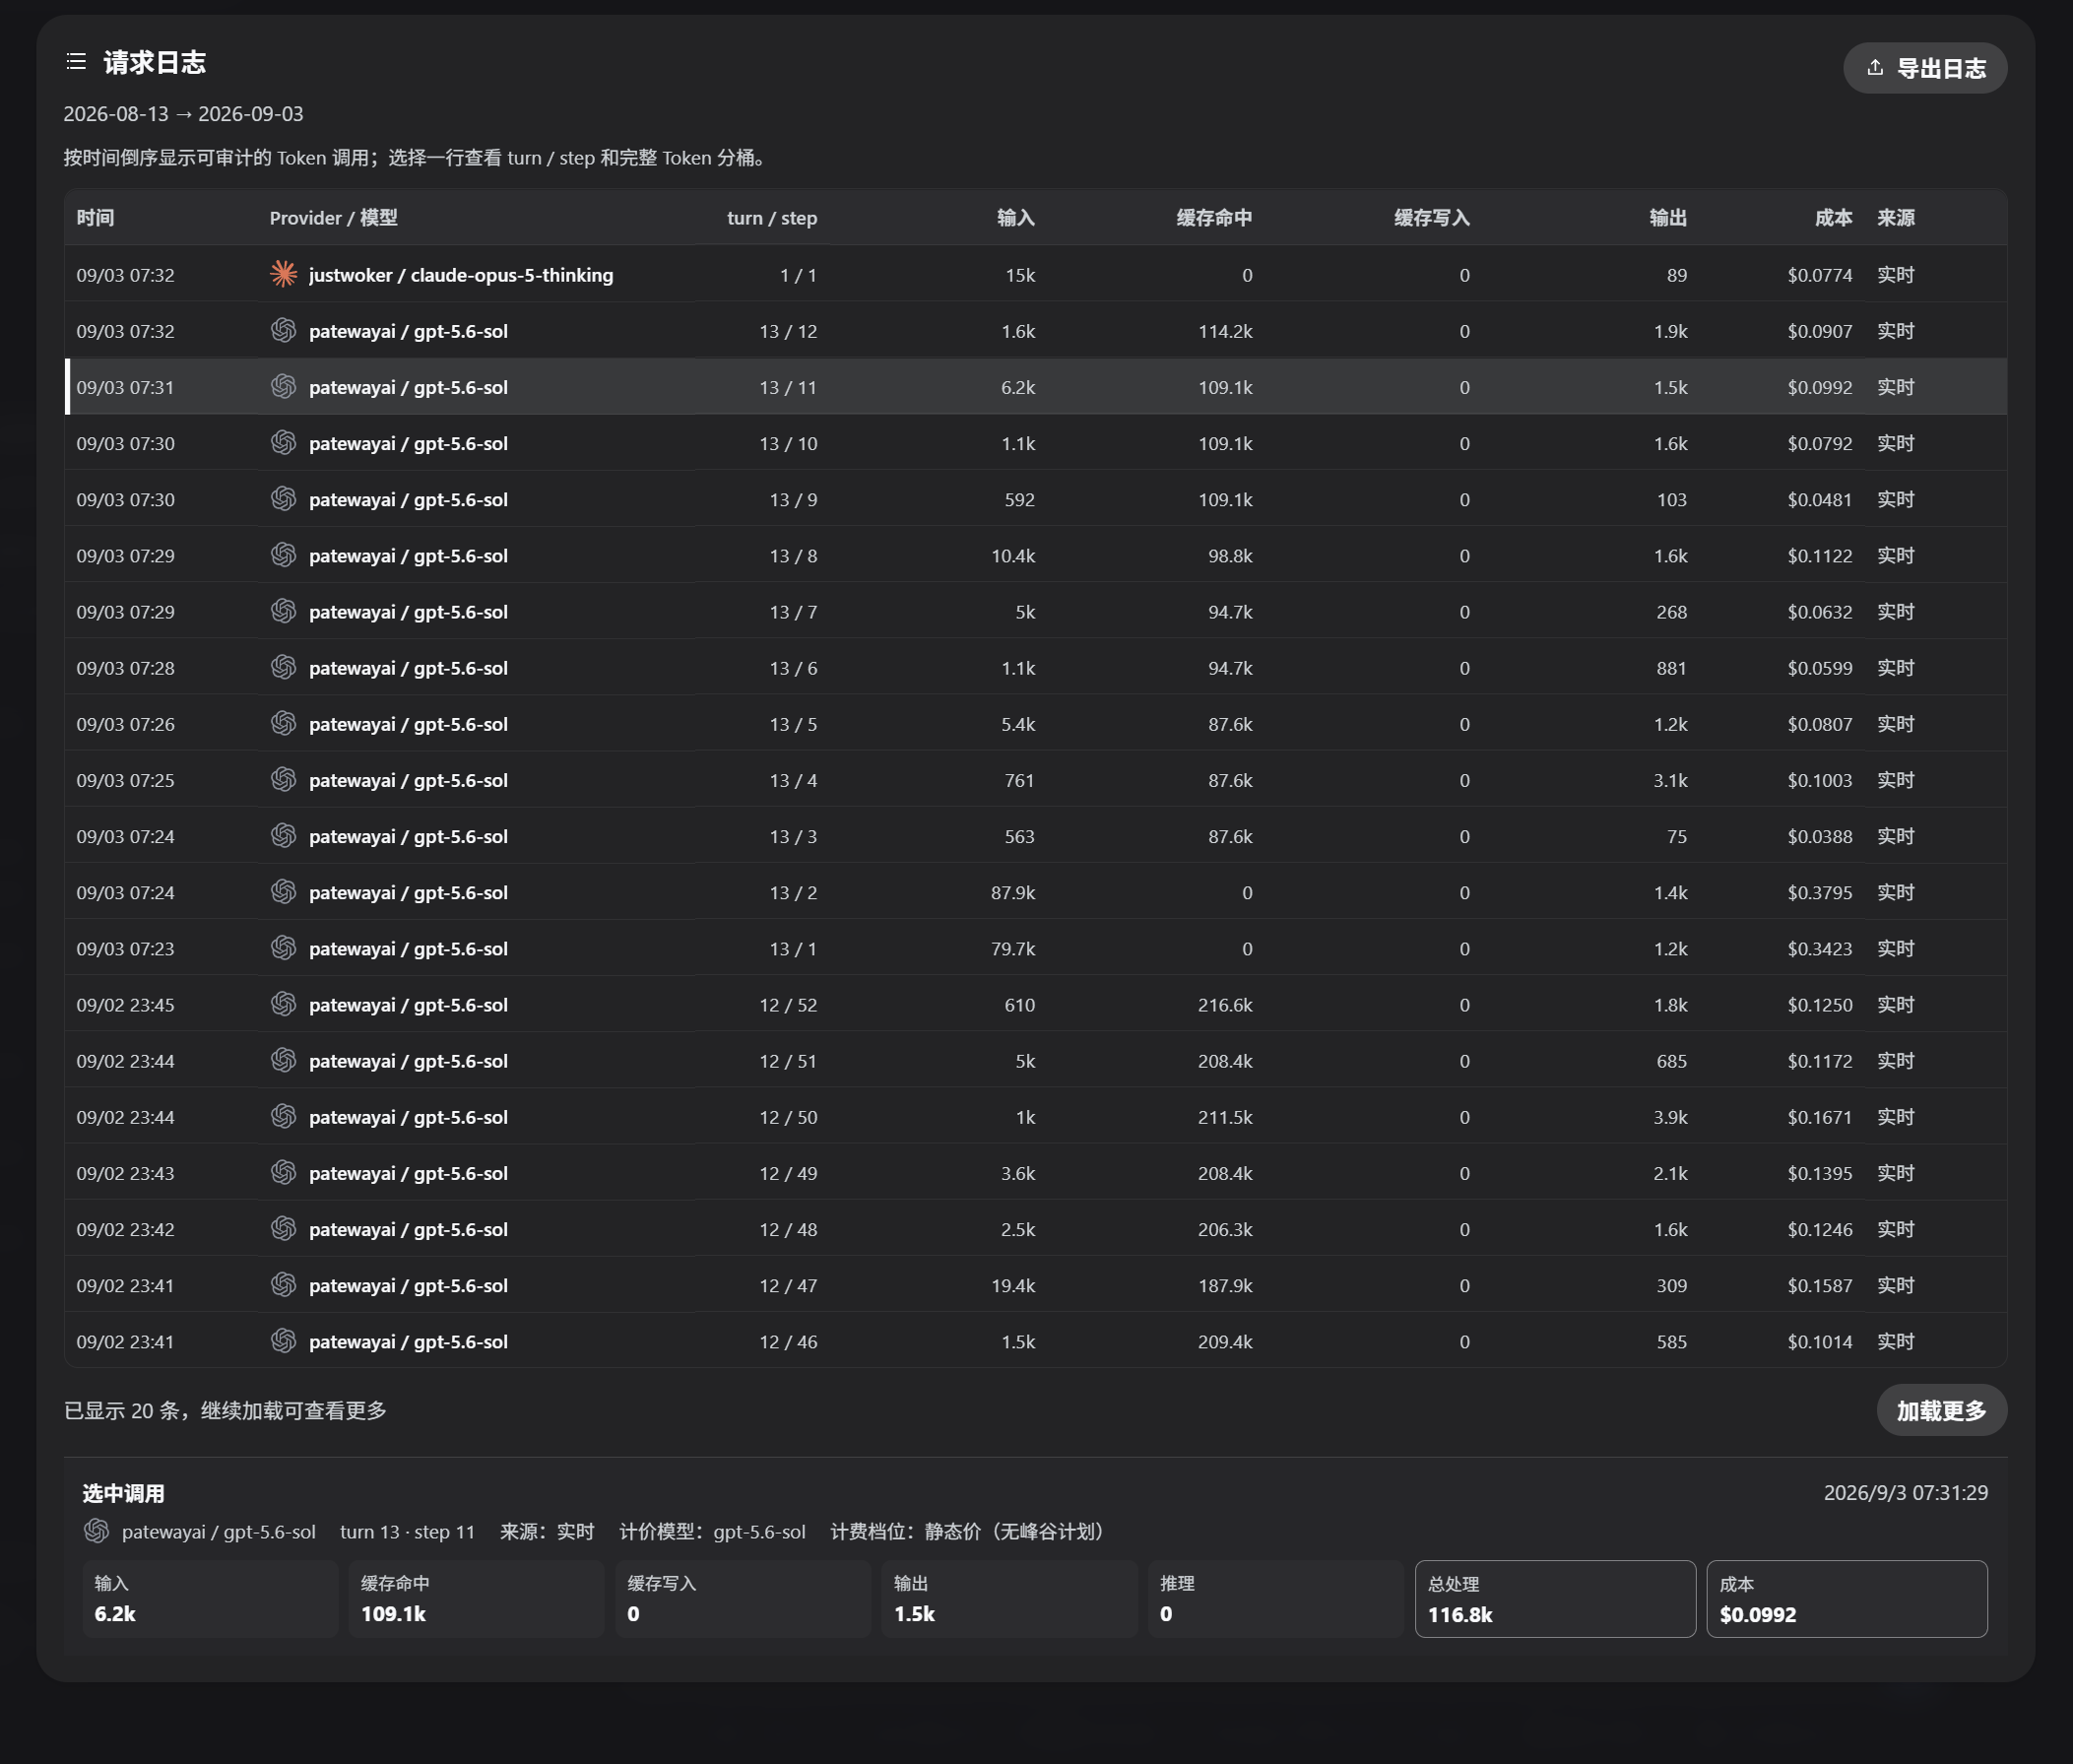
The analysis is granular. Three independent filter axes—model, provider, workspace—can be combined freely. Tokens are split into input, output, cache-read, cache-write, and reasoning buckets; costs follow the models.dev USD-per-1M catalogue with a four-bucket formula that clearly separates priced, free, and unpriced calls. A 53-week heatmap gives the big-picture rhythm, a trend line chart drills into hourly detail for a single day or daily aggregation across a range, with hover for exact values and click-through to that day's records. Account balance, usage streaks, and CSV export round out the picture. The interface switches between Chinese and English, and your choice sticks in the browser.
Under the hood the plugin is deliberately careful about performance. A durable per-session ledger enables incremental backfill: sessions whose logs have not changed are served straight from the ledger on restart without re-reading events, and the browser polls only a lightweight revision, fetching full data only when usage, aliases, or sync state actually change. That keeps multi-workspace, long-history setups fast on both reload and live refresh.
Who is it for? If you run several models or providers through DSH and want a clear answer to where the spend goes, whether caching is paying off, or if you just need a clean, exportable usage report for the team, this plugin fits right into the workflow as the missing dashboard layer.
Screenshots
Use Cases
- Check daily token consumption and the 53-week heatmap
- Compare cache hit rates across models, providers, and workspaces
- Export team usage reports for billing and finance
Best For
- Heavy DSH users running multiple models and providers
- Engineers who need to report usage and cost to their team
- Developers who want to verify whether caching is actually saving tokens
Related Plugins
A service-oriented sidebar framework for DSH, offering a full workbench with file explorer, embedded browser, real terminal, Git panel, and extensible plugin services.

A beautiful, practical Claude Code-style TUI plugin with pixel whale top bar, flowing glow title, real-time status line, streaming thought expansion, time rewind, context progress bar and TPS gauge — zero core changes.

The plugin market for DeepSeek Harness: browse/search/one-click install community plugins and themes, with updates, backup/restore, hot disable, diagnostics, and AI fix.

A persistent whale widget on the DSH web UI that shows DeepSeek balance, today's usage, and per-turn cost, with drag-and-snap and sound effects.