dsh-deepseek-usage-panel
Run the following command in DeepSeek Harness:
dsh plugin install WeiyangPro/dsh-deepseek-usage-panel
Paste the following prompt into your AI chat to install this plugin:
Run dsh plugin install WeiyangPro/dsh-deepseek-usage-panel in your DeepSeek Harness terminal to install this plugin; the source repository is https://github.com/WeiyangPro/dsh-deepseek-usage-panel
About this plugin
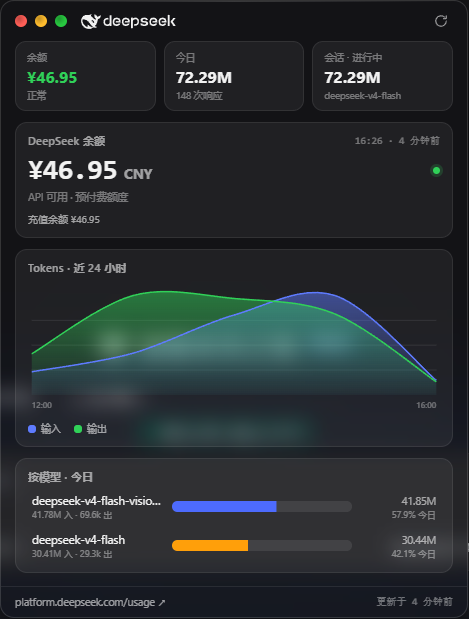
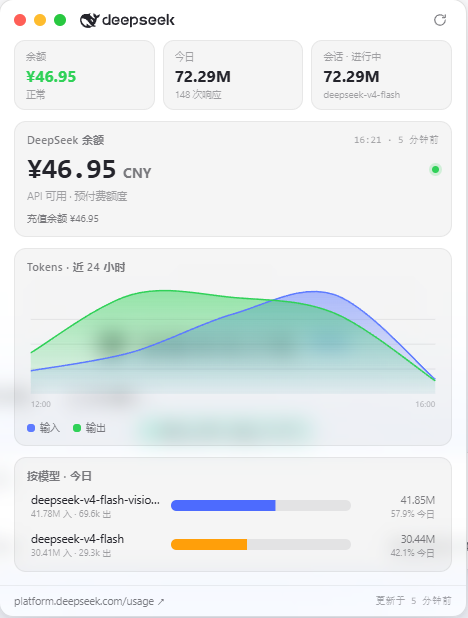
Anyone who runs long sessions on DeepSeek Harness Web knows the ritual: every few minutes you tab over to platform.deepseek.com/usage just to check whether the balance is still alive and how many tokens you have burned today. dsh-deepseek-usage-panel turns that ritual into a glance. It is a macOS-glass floating panel that parks itself in the bottom-right corner of your Harness page; the capsule shows balance, today's usage, and session totals at a glance, and a single click expands the full view.
The panel tracks two things with real depth. First, the official balance: the plugin polls the /user/balance endpoint from the host Node process and pushes only the parsed numbers (current balance, prepaid balance) to the browser, so what you see is DeepSeek's own figure while the API key never leaves the server-side runtime. Second, token usage across four dimensions — today, the active session, a smooth 24-hour trend curve (inputs and outputs drawn separately, with cache-hit and cache-miss broken out), and a per-model share view. Everything is written atomically to a local state.json and migrated automatically on upgrade or reinstall.
The interaction stays deliberately light: drag the capsule anywhere and its position is remembered; the panel automatically picks an expansion direction based on where the capsule sits; ESC, the three traffic-light dots, or a click collapses it with a short transition; and a one-click refresh spins the icon and flashes a confirmation. No browser extension, no extra tab — your focus stays on the code.
Who is this for? If you run multiple long tasks per day on Harness and want a constant, at-a-glance read on balance watermark and token burn rate, or if your team shares a single API key and wants to avoid the surprise of a suddenly empty account, this small panel is close to essential. It does not replace the official usage page for absolute billing totals, but for relative trends and composition it is remarkably clear.
Screenshots
Use Cases
- Monitor balance and token burn rate during long Harness sessions
- Avoid unexpected balance depletion when sharing an API key on a team
- Track per-model and cache-hit token share across multi-turn conversations
Best For
- Developers running multiple long sessions on DeepSeek Harness daily
- Solo developers or small teams who need real-time balance awareness
- Efficiency-minded users who want to avoid constant tab-switching for usage checks
Related Plugins
A service-oriented sidebar framework for DSH, offering a full workbench with file explorer, embedded browser, real terminal, Git panel, and extensible plugin services.

A beautiful, practical Claude Code-style TUI plugin with pixel whale top bar, flowing glow title, real-time status line, streaming thought expansion, time rewind, context progress bar and TPS gauge — zero core changes.

The plugin market for DeepSeek Harness: browse/search/one-click install community plugins and themes, with updates, backup/restore, hot disable, diagnostics, and AI fix.

A persistent whale widget on the DSH web UI that shows DeepSeek balance, today's usage, and per-turn cost, with drag-and-snap and sound effects.