dsh-metrics-panel
Run the following command in DeepSeek Harness:
dsh plugin install bulai-z/dsh-metrics-panel
Paste the following prompt into your AI chat to install this plugin:
Run dsh plugin install bulai-z/dsh-metrics-panel in your terminal; the source is hosted at https://github.com/bulai-z/dsh-metrics-panel. After installation and a dsh web restart, the usage monitor panel will appear at the bottom-right corner of the DSH interface.
About this plugin
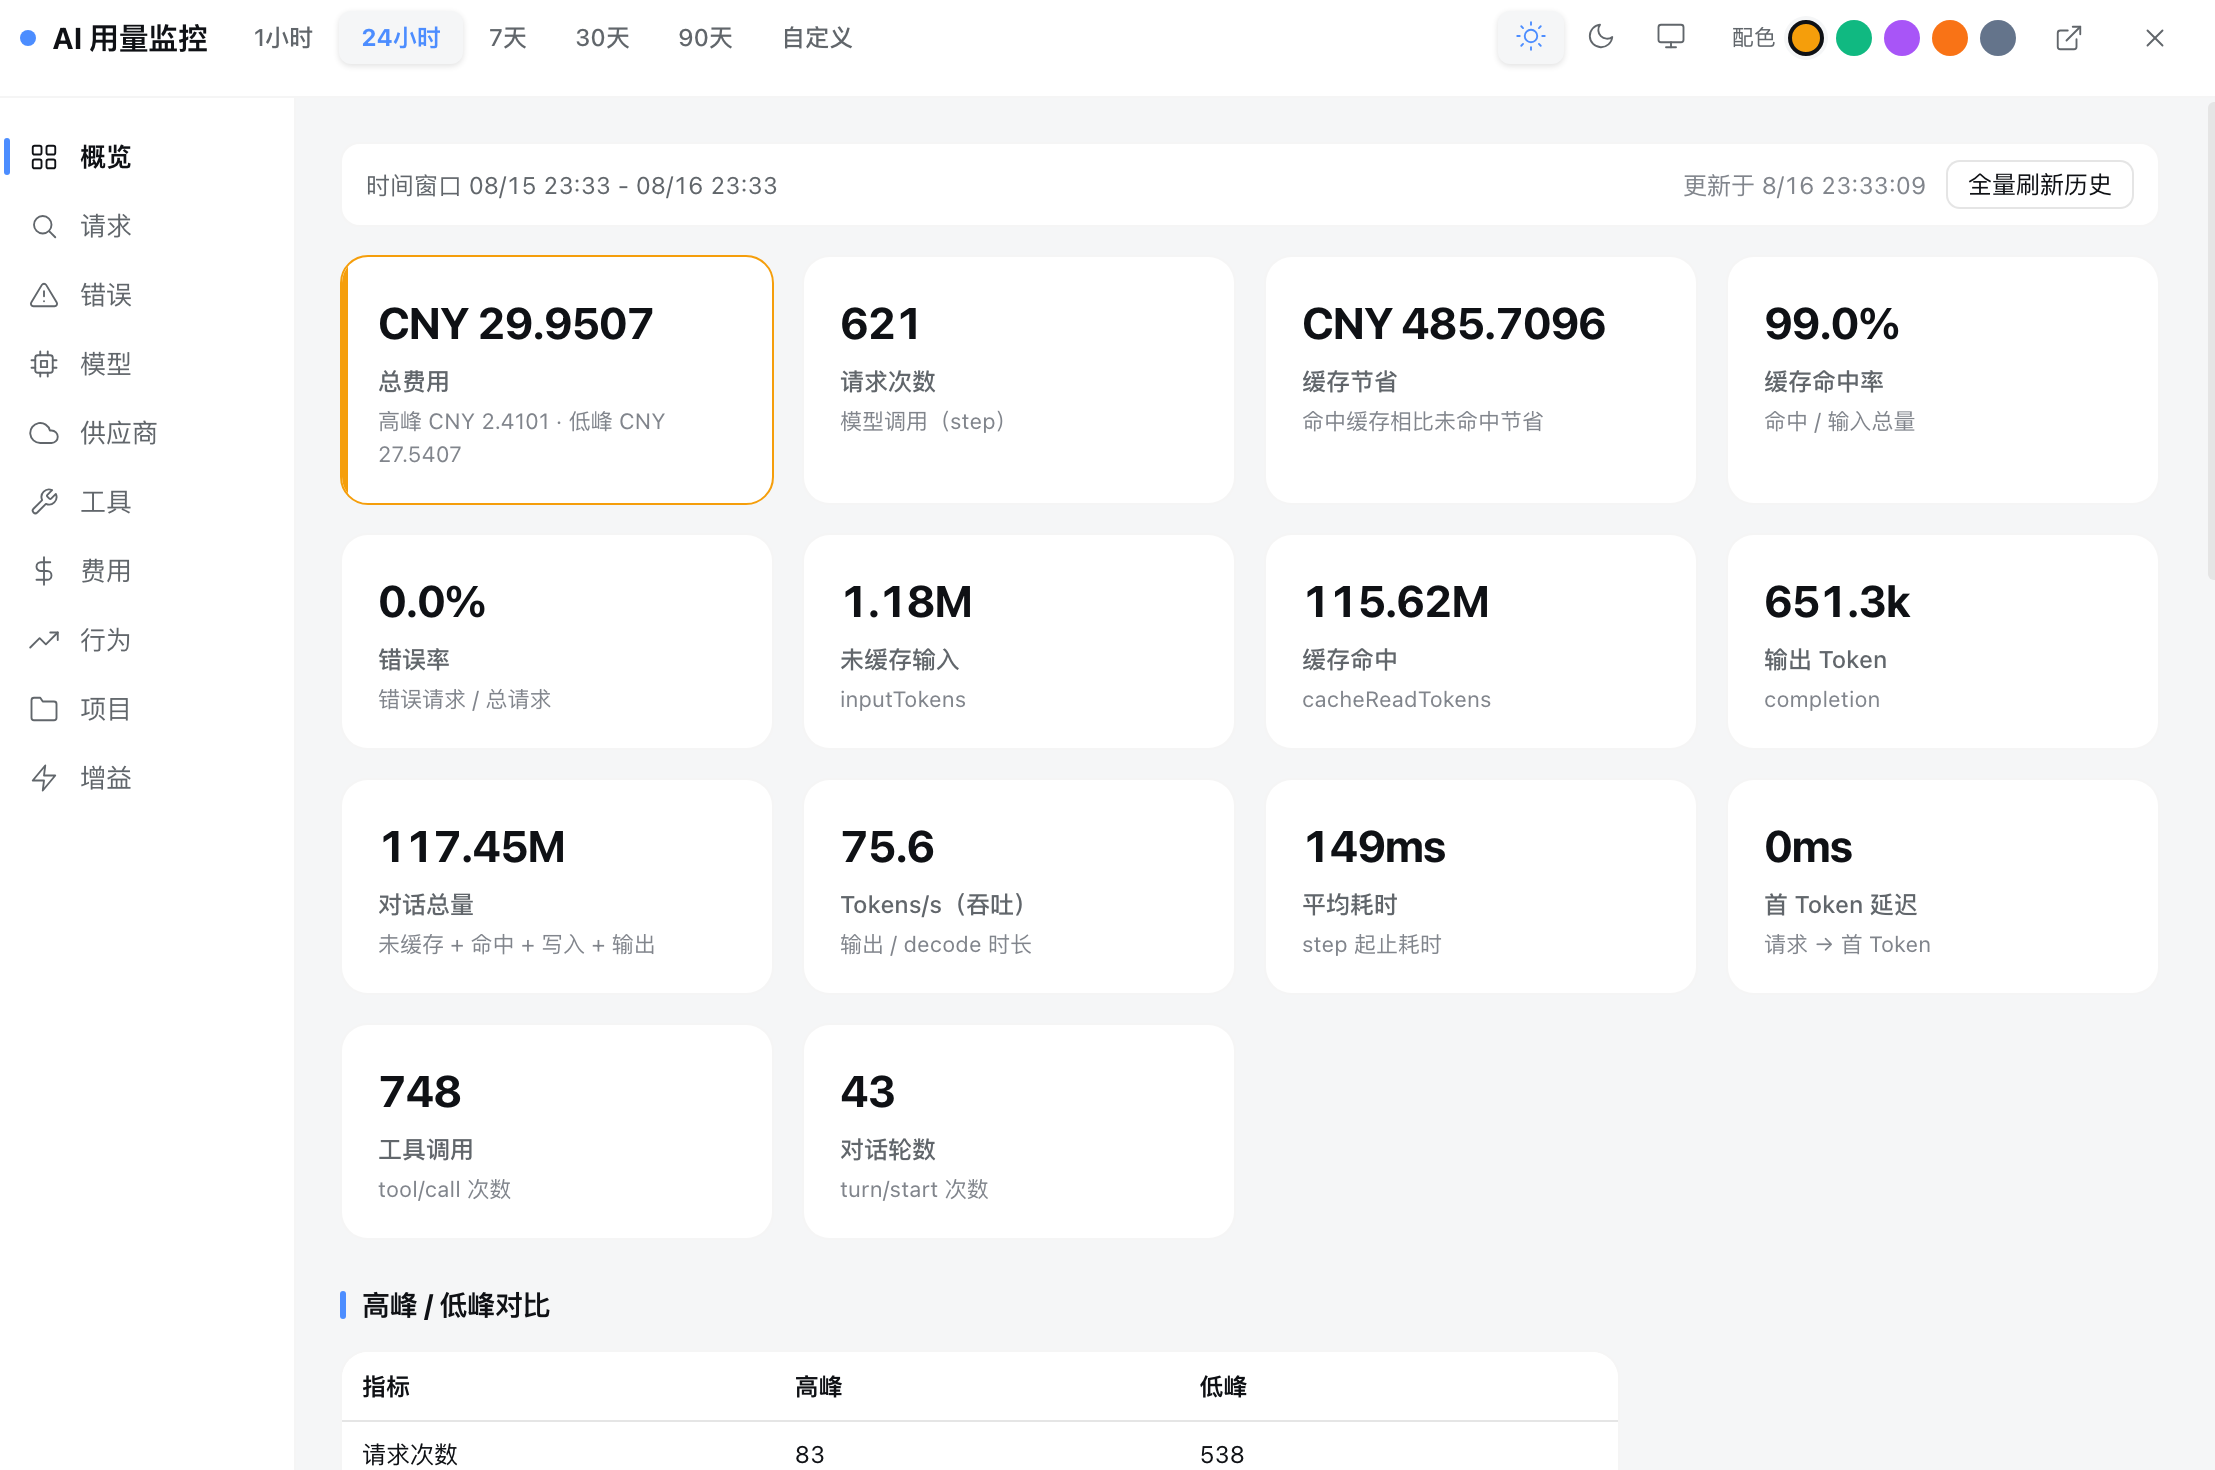
When running LLM workloads in DeepSeek Harness, token spend, cache hit rates, and real costs tend to scatter across event streams and console logs, leaving no single place to see the full picture at a glance. dsh-metrics-panel solves exactly that: it injects a floating panel into the DSH web interface, captures every API call s usage, parameters, and results from the session event stream in real time, and turns the numbers buried in logs into interactive overviews, paginated request details, and aggregate charts.
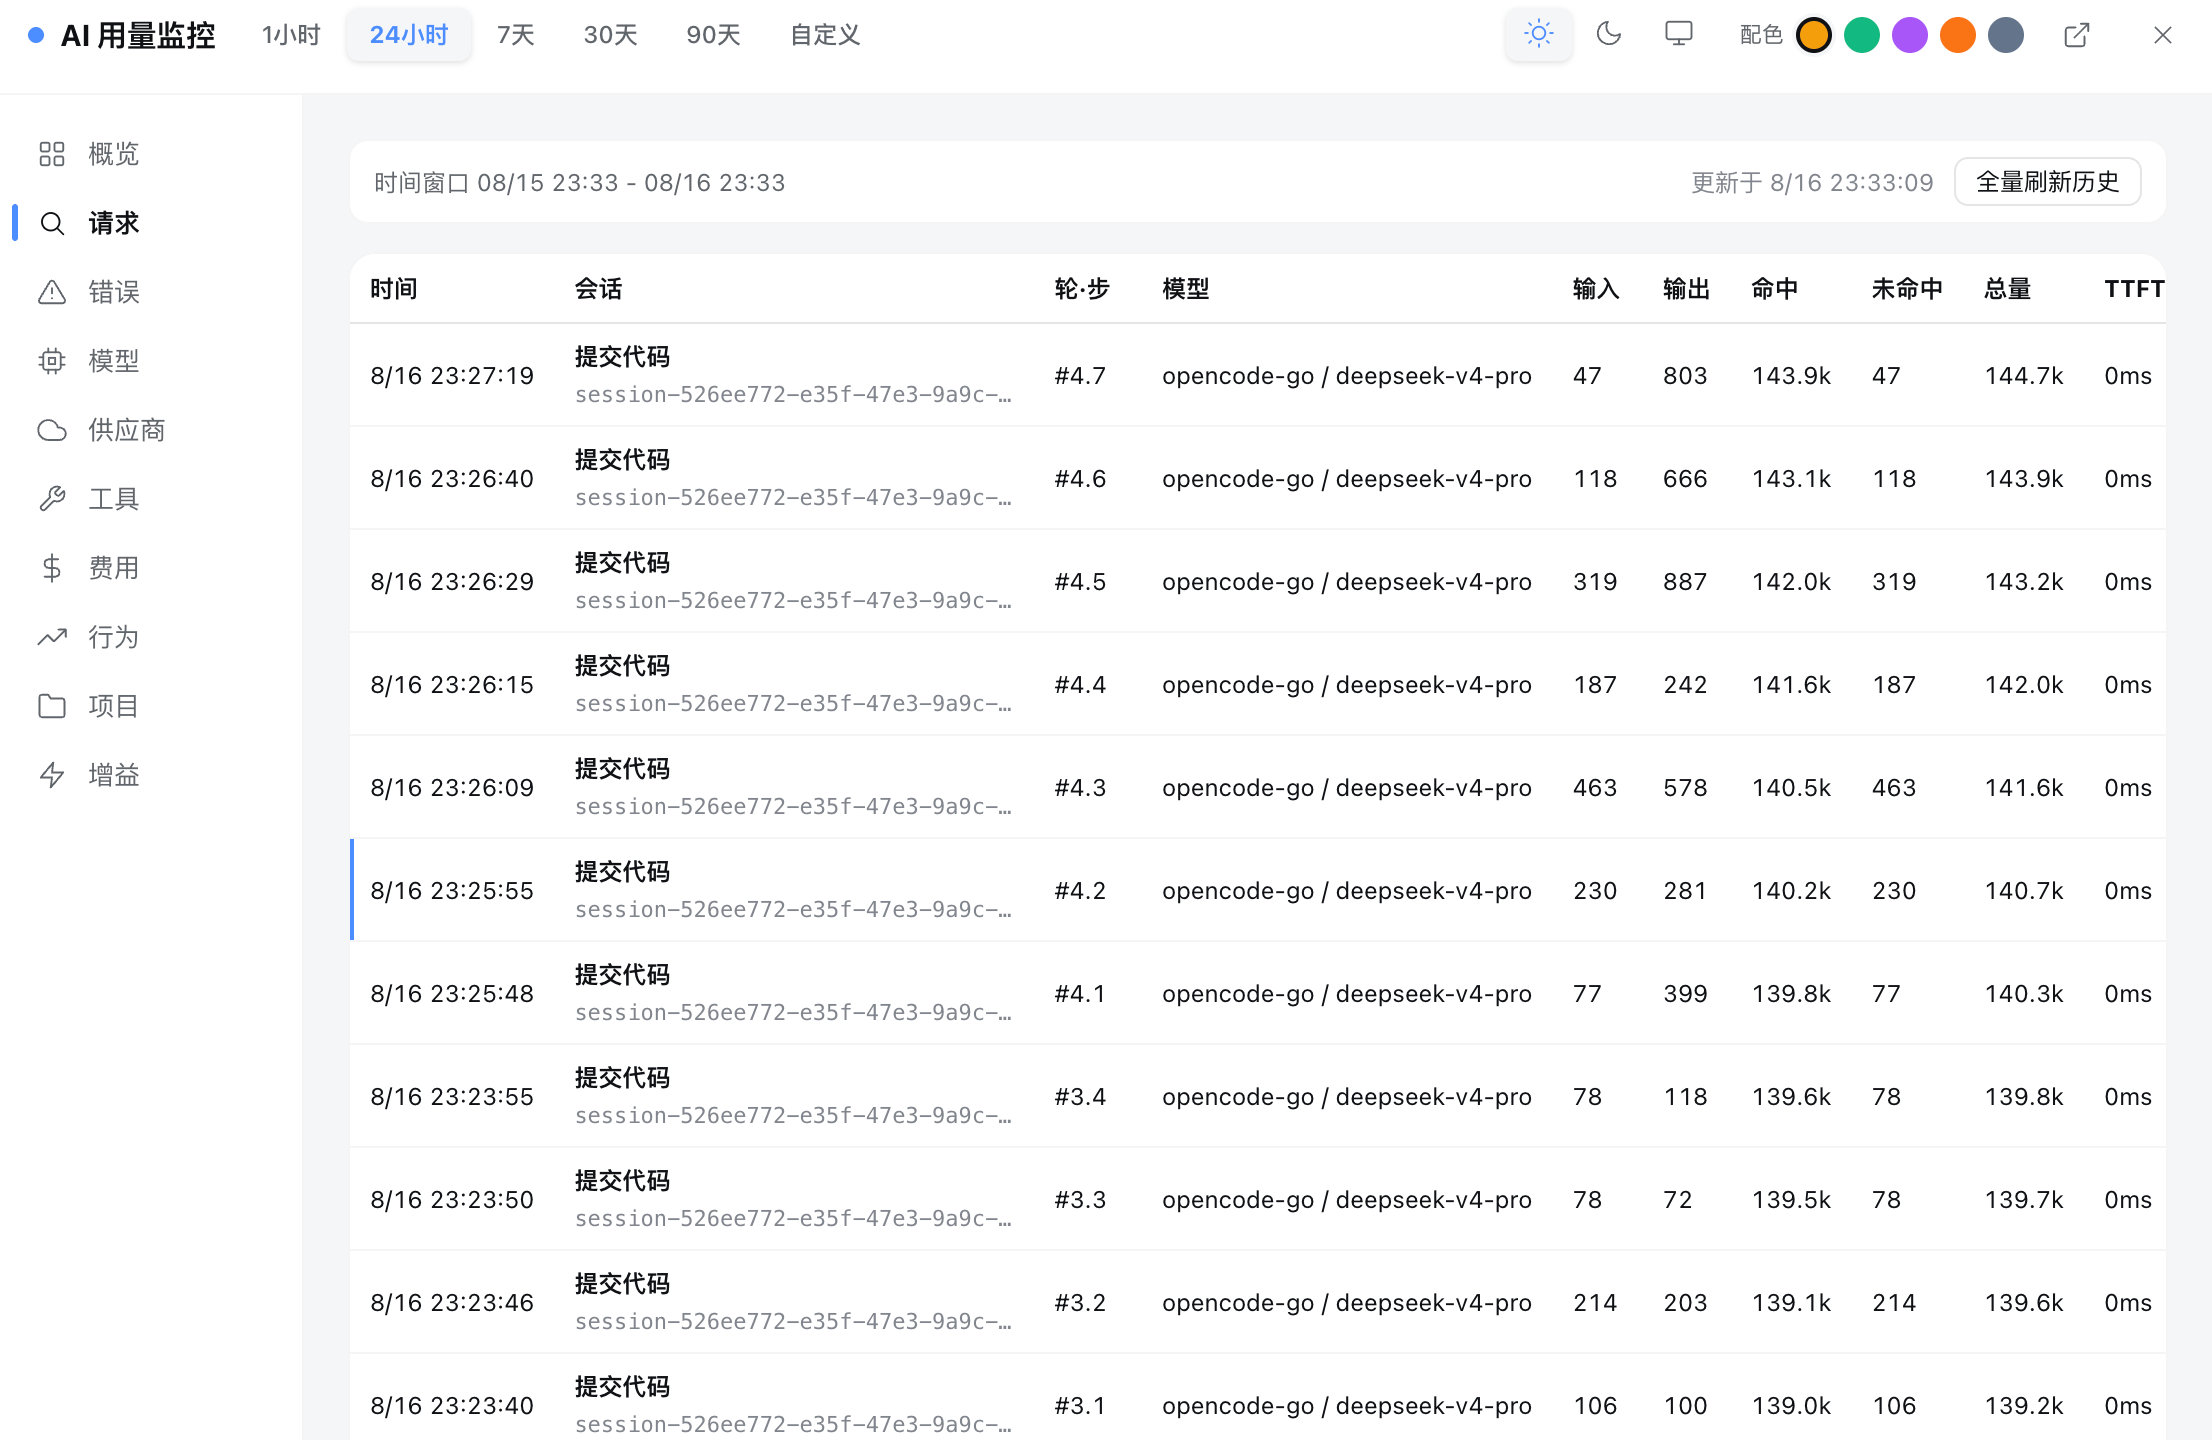
The panel offers ten sections covering cost and token distribution by hour, a paginated request list (with service endpoint, sampling parameters, tool calls, and a redacted HTTP example), an error log with error rates, and usage/cost aggregates broken down by model, provider, and tool. Pricing supports three tiers -- cache hit, non-hit input, and output -- with per-provider peak/off-peak windows for automatic tier switching, and ships with DeepSeek s official list prices as defaults. Theme can be set to light, dark, or system-following, and five chart palettes persist across sessions.
If you are driving multi-model, multi-provider Agent workloads in DeepSeek Harness and want to know how many tokens each turn consumed, how much the cache saved, which model is the most expensive, and which requests failed, this panel is the usage dashboard you have been looking for.
Screenshots
Use Cases
- Monitor real-time token usage and cost distribution across multi-model workflows
- Compare cache hit rates and real costs between providers
- Debug failed requests with full sampling parameters and tool calls
Best For
- Developers running Agent workloads on DeepSeek Harness
- R&D teams tracking multi-model API call costs and performance
- Engineers optimizing cache hit rates and inference costs
Related Plugins
A service-oriented sidebar framework for DSH, offering a full workbench with file explorer, embedded browser, real terminal, Git panel, and extensible plugin services.

A beautiful, practical Claude Code-style TUI plugin with pixel whale top bar, flowing glow title, real-time status line, streaming thought expansion, time rewind, context progress bar and TPS gauge — zero core changes.

The plugin market for DeepSeek Harness: browse/search/one-click install community plugins and themes, with updates, backup/restore, hot disable, diagnostics, and AI fix.

A persistent whale widget on the DSH web UI that shows DeepSeek balance, today's usage, and per-turn cost, with drag-and-snap and sound effects.