dsh-usage-stats
Run the following command in DeepSeek Harness:
dsh plugin install 2421873411a-rgb/dsh-usage-stats
Paste the following prompt into your AI chat to install this plugin:
Run dsh plugin install 2421873411a-rgb/dsh-usage-stats in the DeepSeek Harness terminal to install; source code: https://github.com/2421873411a-rgb/dsh-usage-stats
About this plugin
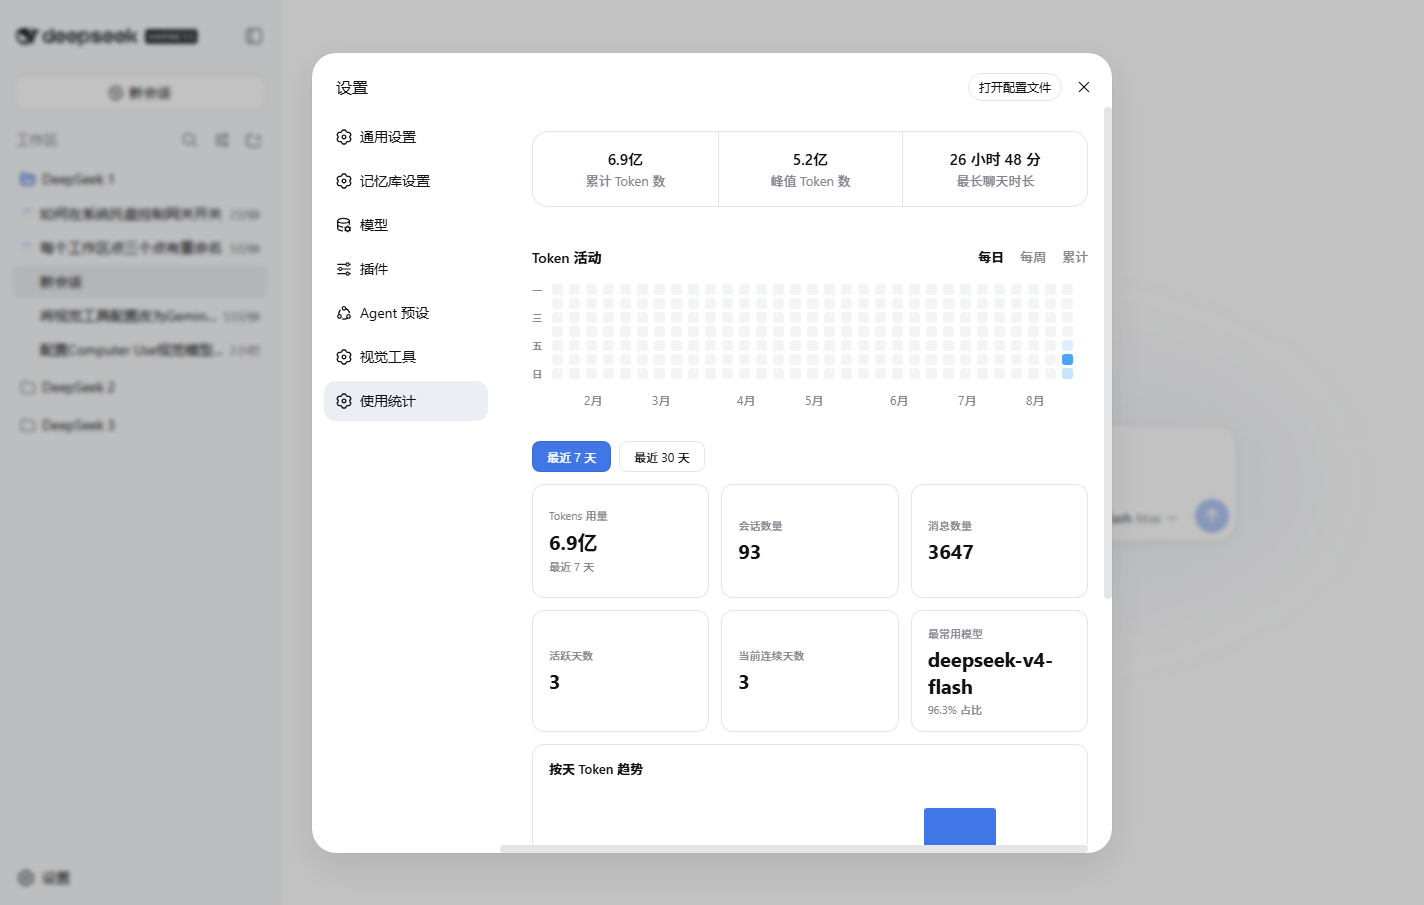
A week into using DSH Web and you still cannot answer two simple questions: how many tokens did you actually burn, and which model used the most? dsh-usage-stats closes that gap. It reads your local billing log and surfaces real numbers on the Settings to Usage Stats page, showing cumulative tokens, single-day peak, and longest session duration, so monthly cost stops being a guess.
The visual layer is where it truly shines. A token activity heatmap lays out Monday-through-Sunday cells in daily, weekly, or cumulative modes, making usage spikes and quiet stretches obvious at a glance. A per-day stacked bar chart color-codes each model, so hovering over any bar reveals the total and a per-model breakdown for that date. A donut chart summarizes model share, automatically merging anything past six models into Other to keep the ring readable.
It is built for developers who lean on DSH Web daily, small teams that need a quick cost sanity-check, and anyone who simply wants to stop wondering how much they used. Every metric is drawn from locally recorded consumption, with no external calls and no estimates. Install it and your usage story is there.
Screenshots
Use Cases
- Check real cumulative, peak, and longest-session token figures
- Spot usage spikes fast with heatmaps and stacked bars
- Break down consumption by model to verify per-model share
Best For
- Developers who rely on DSH Web daily
- Small teams needing quick cost sanity-checks
- Individual users tracking personal token usage
Related Plugins
A service-oriented sidebar framework for DSH, offering a full workbench with file explorer, embedded browser, real terminal, Git panel, and extensible plugin services.

A beautiful, practical Claude Code-style TUI plugin with pixel whale top bar, flowing glow title, real-time status line, streaming thought expansion, time rewind, context progress bar and TPS gauge — zero core changes.

The plugin market for DeepSeek Harness: browse/search/one-click install community plugins and themes, with updates, backup/restore, hot disable, diagnostics, and AI fix.

A persistent whale widget on the DSH web UI that shows DeepSeek balance, today's usage, and per-turn cost, with drag-and-snap and sound effects.