dsh-tokstat
Run the following command in DeepSeek Harness:
dsh plugin install kongjianguan/dsh-tokstat
Paste the following prompt into your AI chat to install this plugin:
Run dsh plugin install kongjianguan/dsh-tokstat in your terminal; the source code is available at https://github.com/kongjianguan/dsh-tokstat
About this plugin
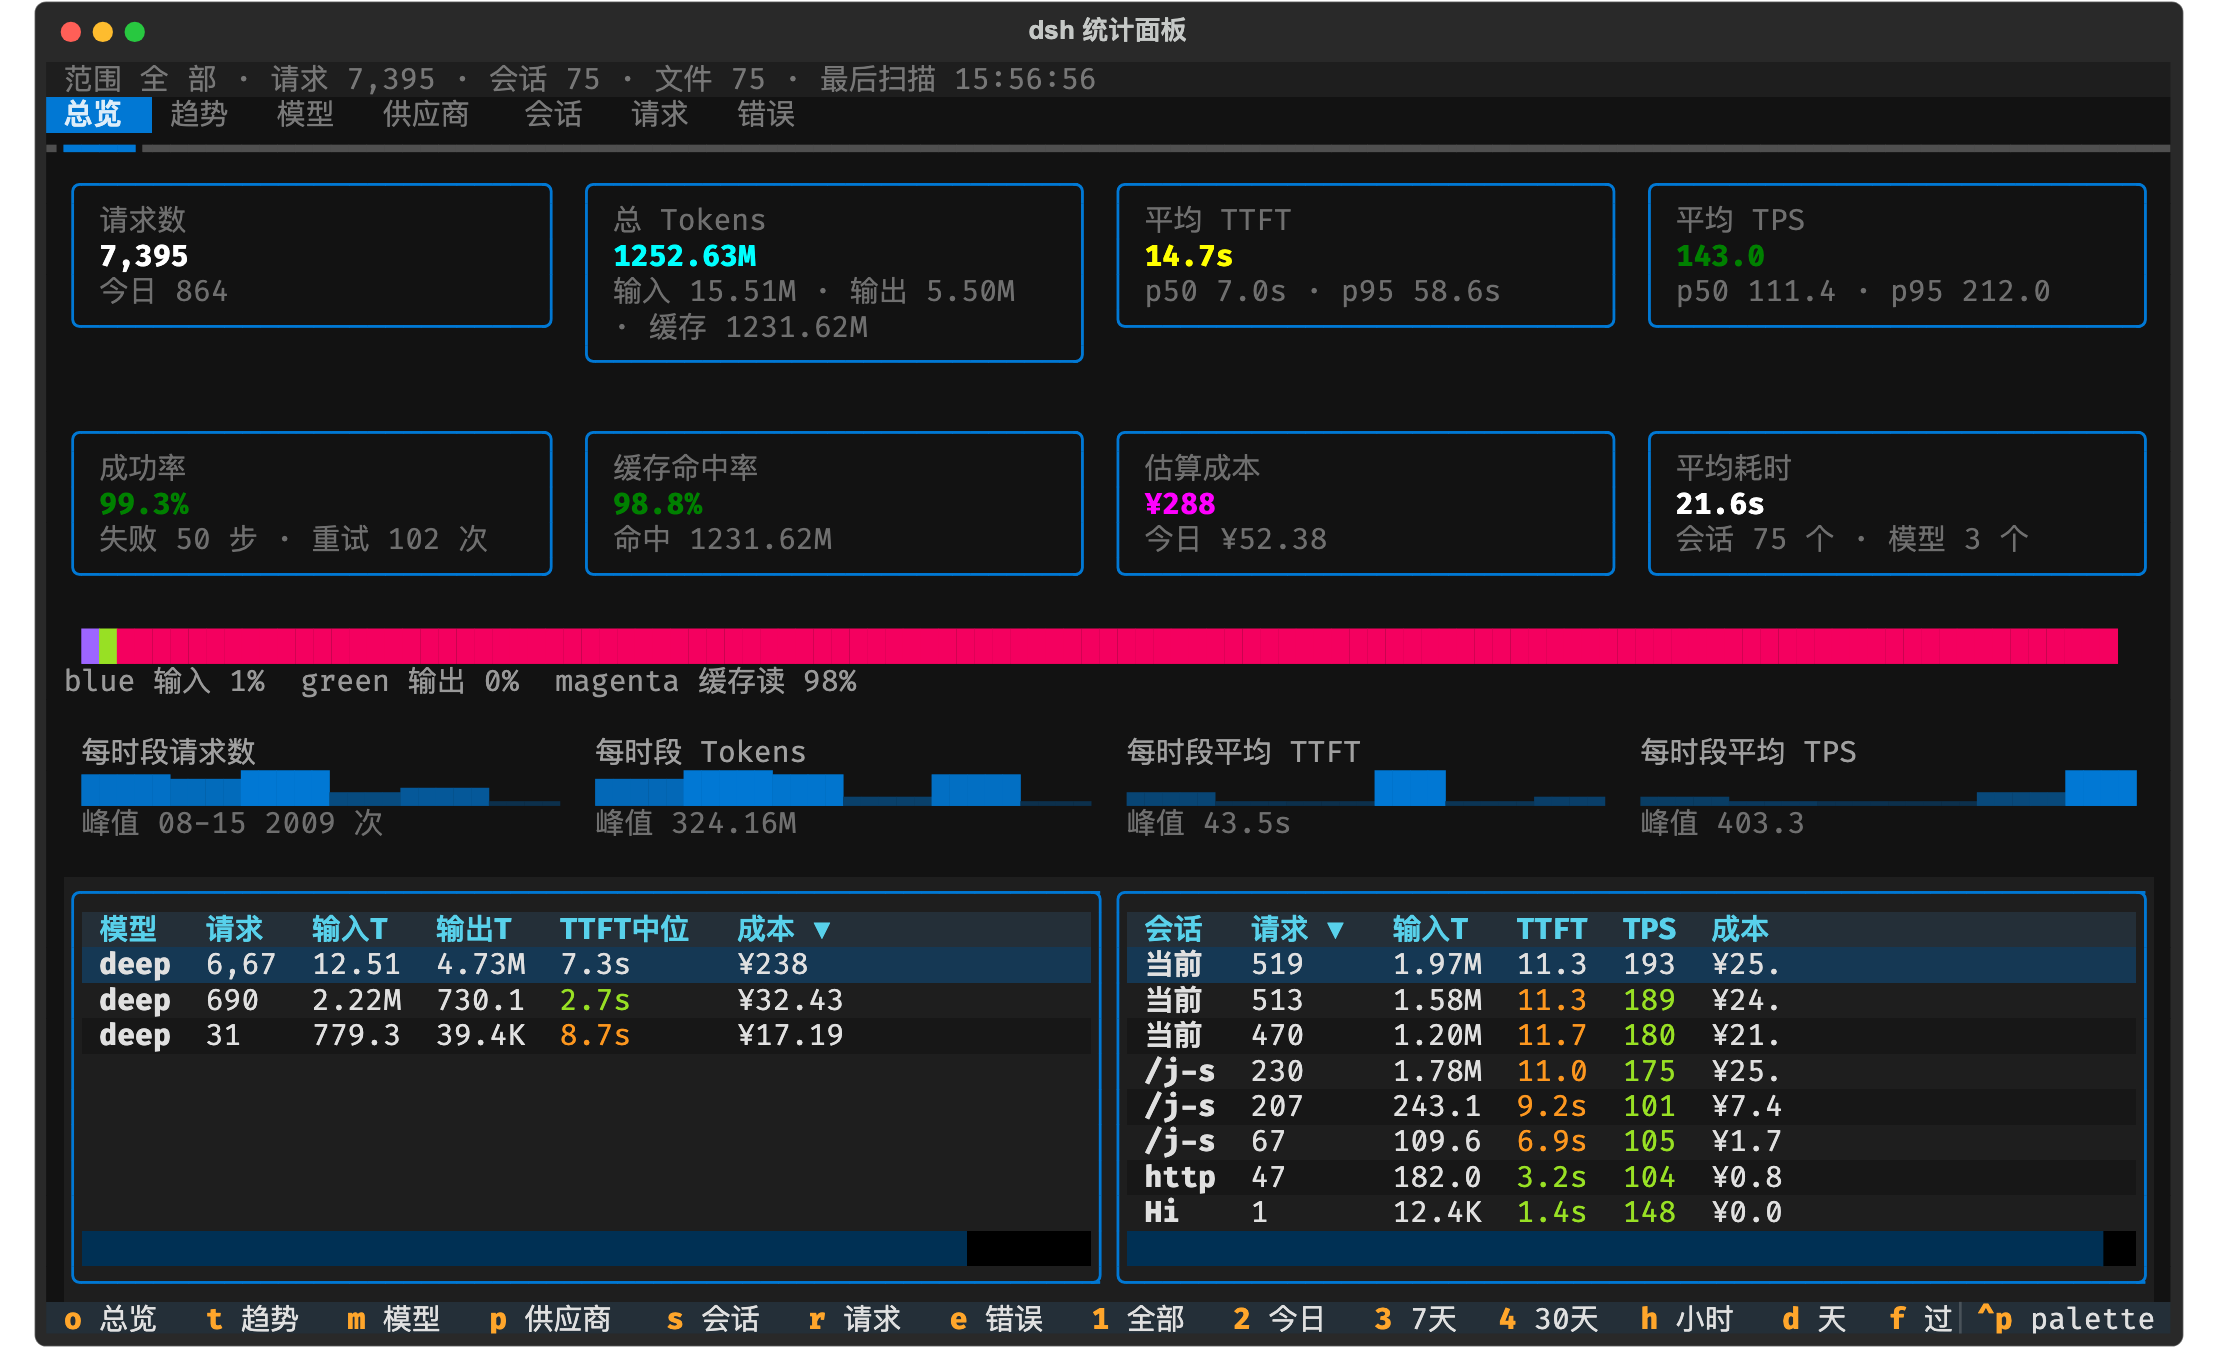
You likely run a large volume of LLM requests through dsh every day, yet piecing together total token spend, per-request first-token latency, throughput, and silent retry costs from scattered log files is surprisingly tedious. dsh-tokstat reads dsh session logs directly (zstd frame-level incremental parsing under ~/.dsh/sessions) and reconstructs every LLM call into analyzable metrics: input, output, and cached tokens; TTFT; TPS; wall-clock duration; retry and failure counts; and estimated cost—all aligned with the official sessionStats projection.
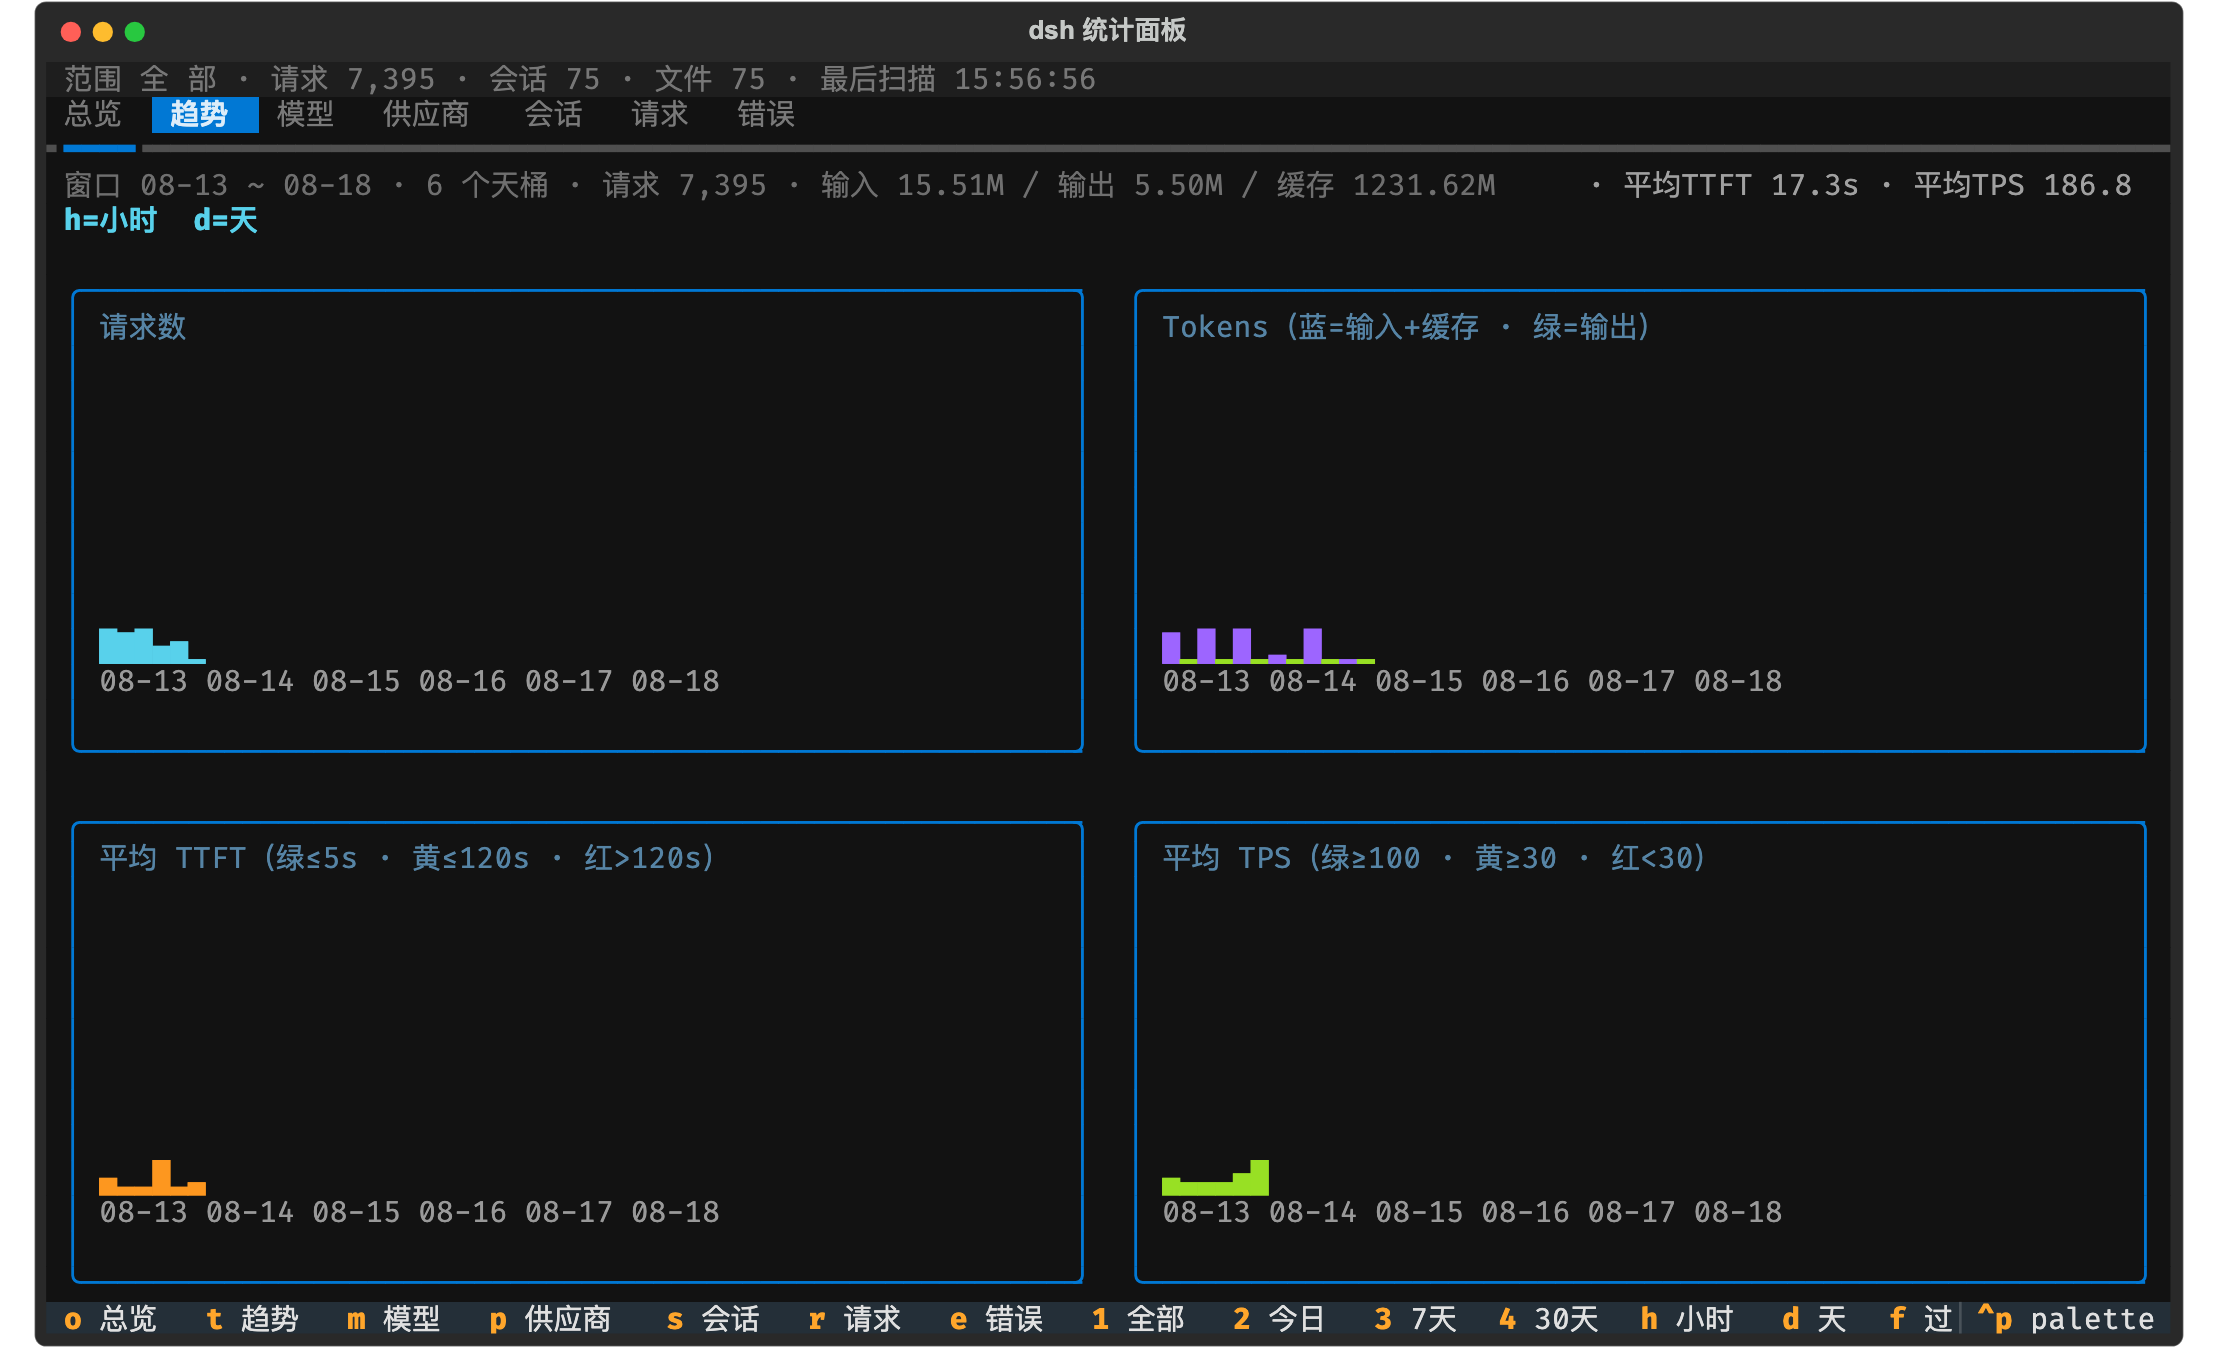
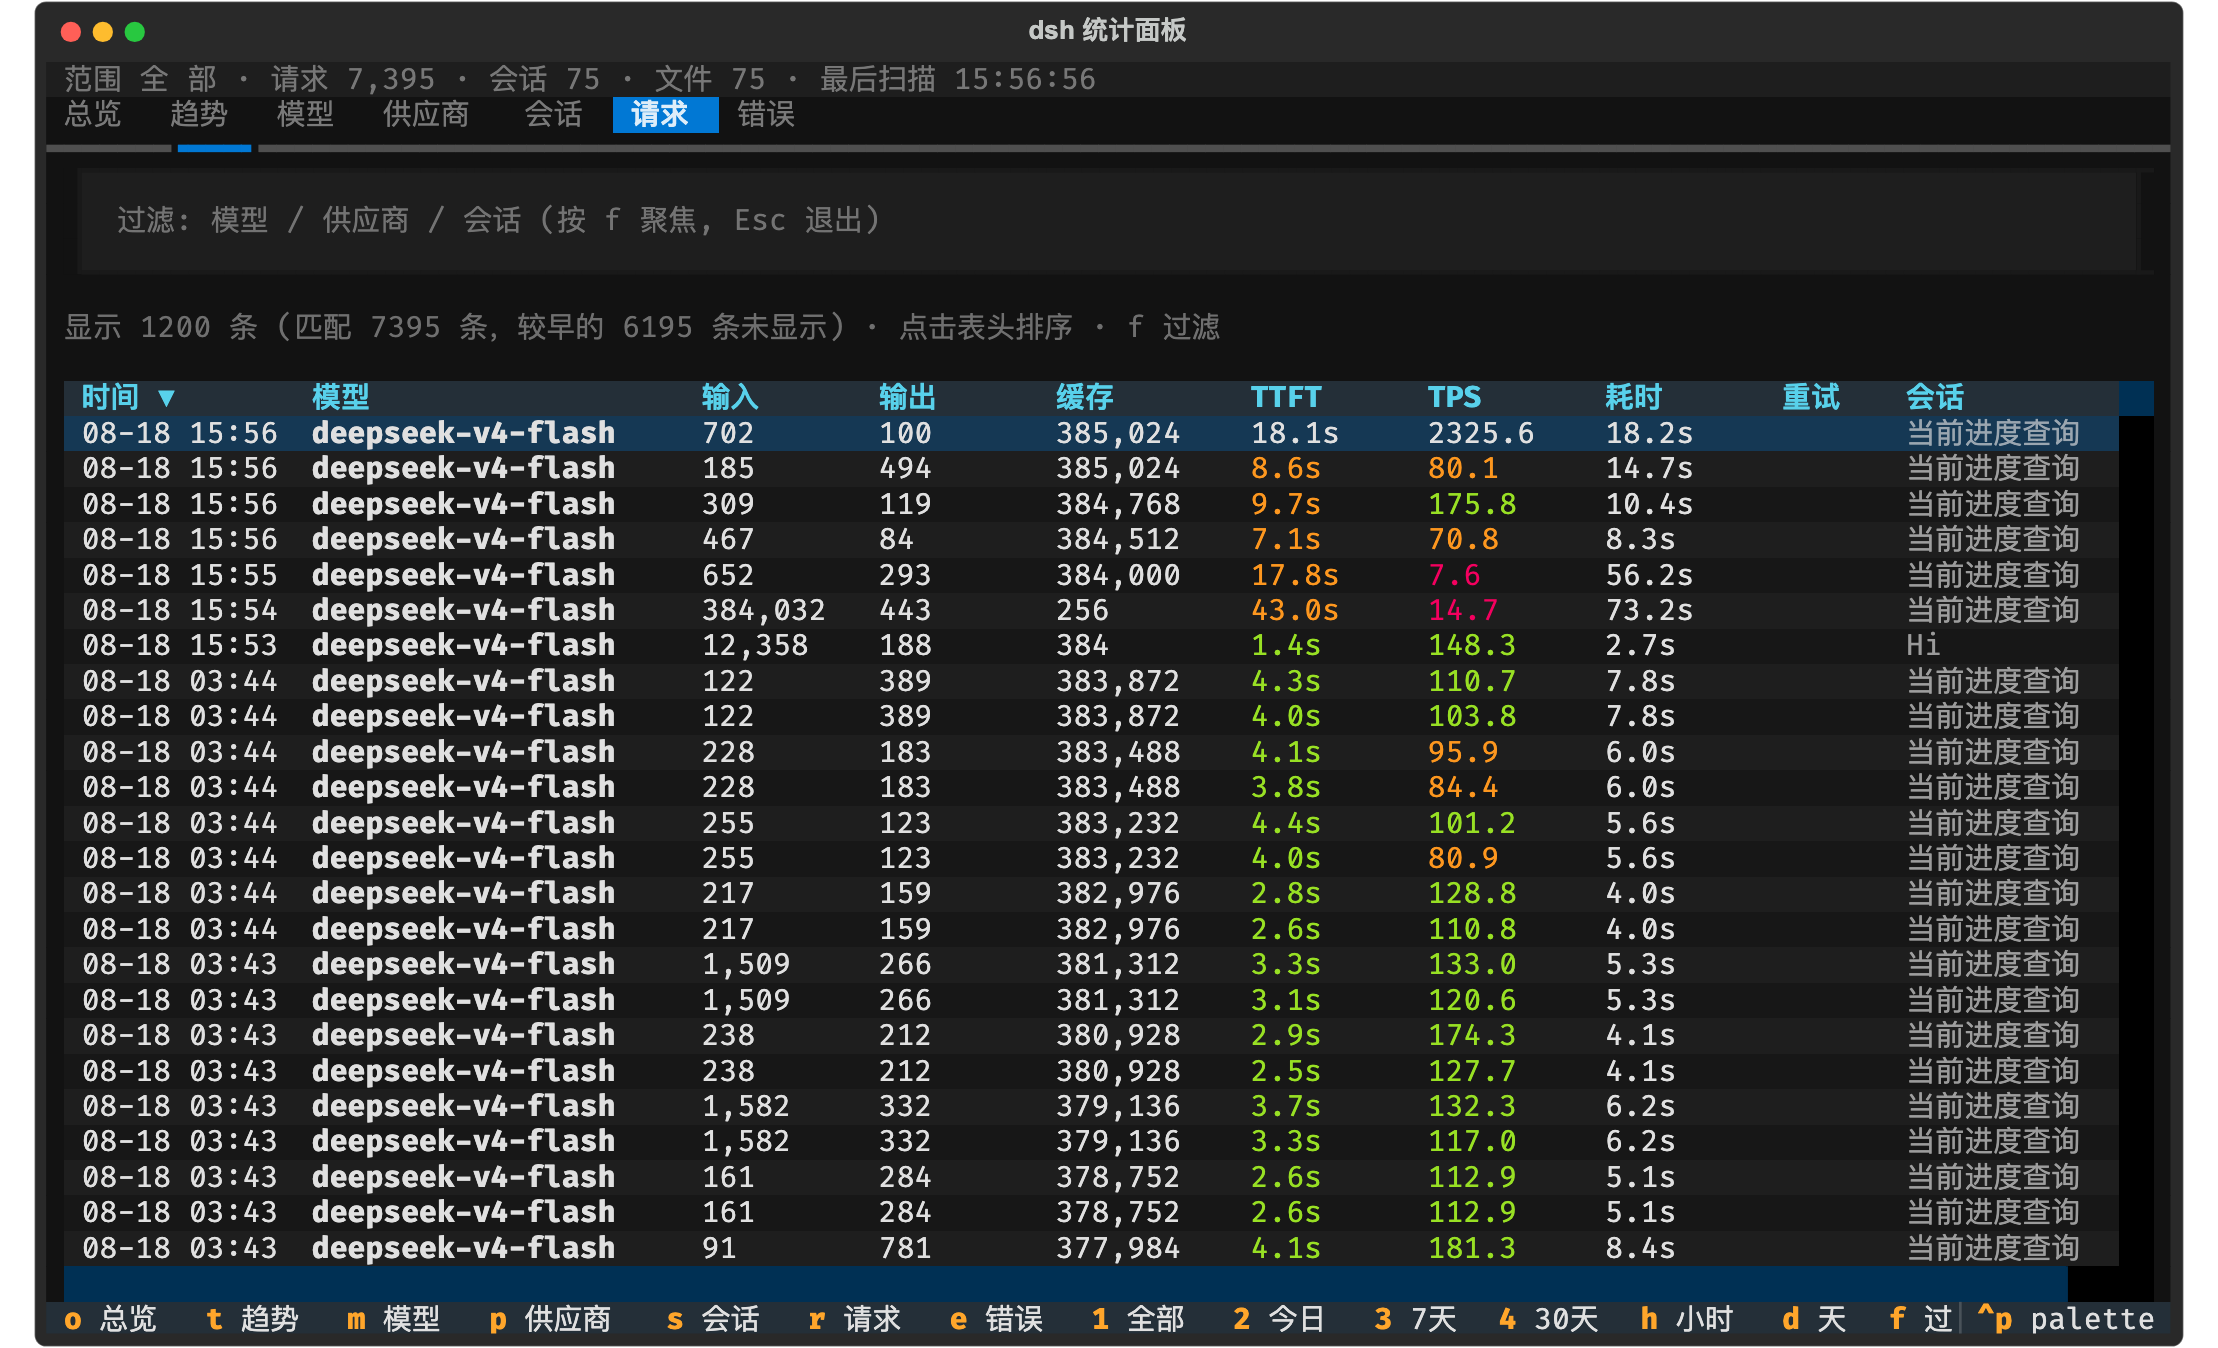
The plugin ships in two complementary forms. The first is a "Stats" section inside the dsh web settings page that polls every two seconds, giving you at-a-glance overview, per-model, per-session, and per-request breakdowns right in your browser. The second is a standalone Python terminal TUI with seven views toggled by the keys o-t-m-p-s-r-e, covering a dashboard hero card with sparklines, hourly or daily token and latency trend charts, per-model and per-provider comparison tables with sortable columns, per-session drill-down, a scrollable request log (up to 1 200 rows with keyword filtering), and an error distribution panel that breaks down retry causes and flags failed steps.
It is built for three audiences: everyday users who want to know exactly how many tokens and how much money dsh burns each day; model evaluators comparing providers on TTFT, TPS, and cache-hit rates; and heavy agent users who need to pinpoint which step in a long chain is silently retrying or timing out. No extra infrastructure is required—install the plugin, restart dsh, and the numbers appear.
Screenshots
Use Cases
- Track how many tokens and how much money dsh burns each day
- Compare TTFT, TPS, and cache-hit rates across models and providers
- Pinpoint which step in a long agent chain is retrying or timing out
Best For
- Everyday users who want to keep an eye on daily token and cost spend
- Model evaluators comparing providers on latency and throughput metrics
- Heavy agent users who need to locate silent retries and failures quickly
Related Plugins
A service-oriented sidebar framework for DSH, offering a full workbench with file explorer, embedded browser, real terminal, Git panel, and extensible plugin services.

A beautiful, practical Claude Code-style TUI plugin with pixel whale top bar, flowing glow title, real-time status line, streaming thought expansion, time rewind, context progress bar and TPS gauge — zero core changes.

The plugin market for DeepSeek Harness: browse/search/one-click install community plugins and themes, with updates, backup/restore, hot disable, diagnostics, and AI fix.

A persistent whale widget on the DSH web UI that shows DeepSeek balance, today's usage, and per-turn cost, with drag-and-snap and sound effects.