dsh-ui-tool-graph
Run the following command in DeepSeek Harness:
dsh plugin install rocklau/dsh-ui-tool-graph
Paste the following prompt into your AI chat to install this plugin:
Run dsh plugin install rocklau/dsh-ui-tool-graph in DeepSeek Harness to install; the source is available at https://github.com/rocklau/dsh-ui-tool-graph . Restart dsh web afterwards and the Tool Graph tab will appear in every session header.
About this plugin
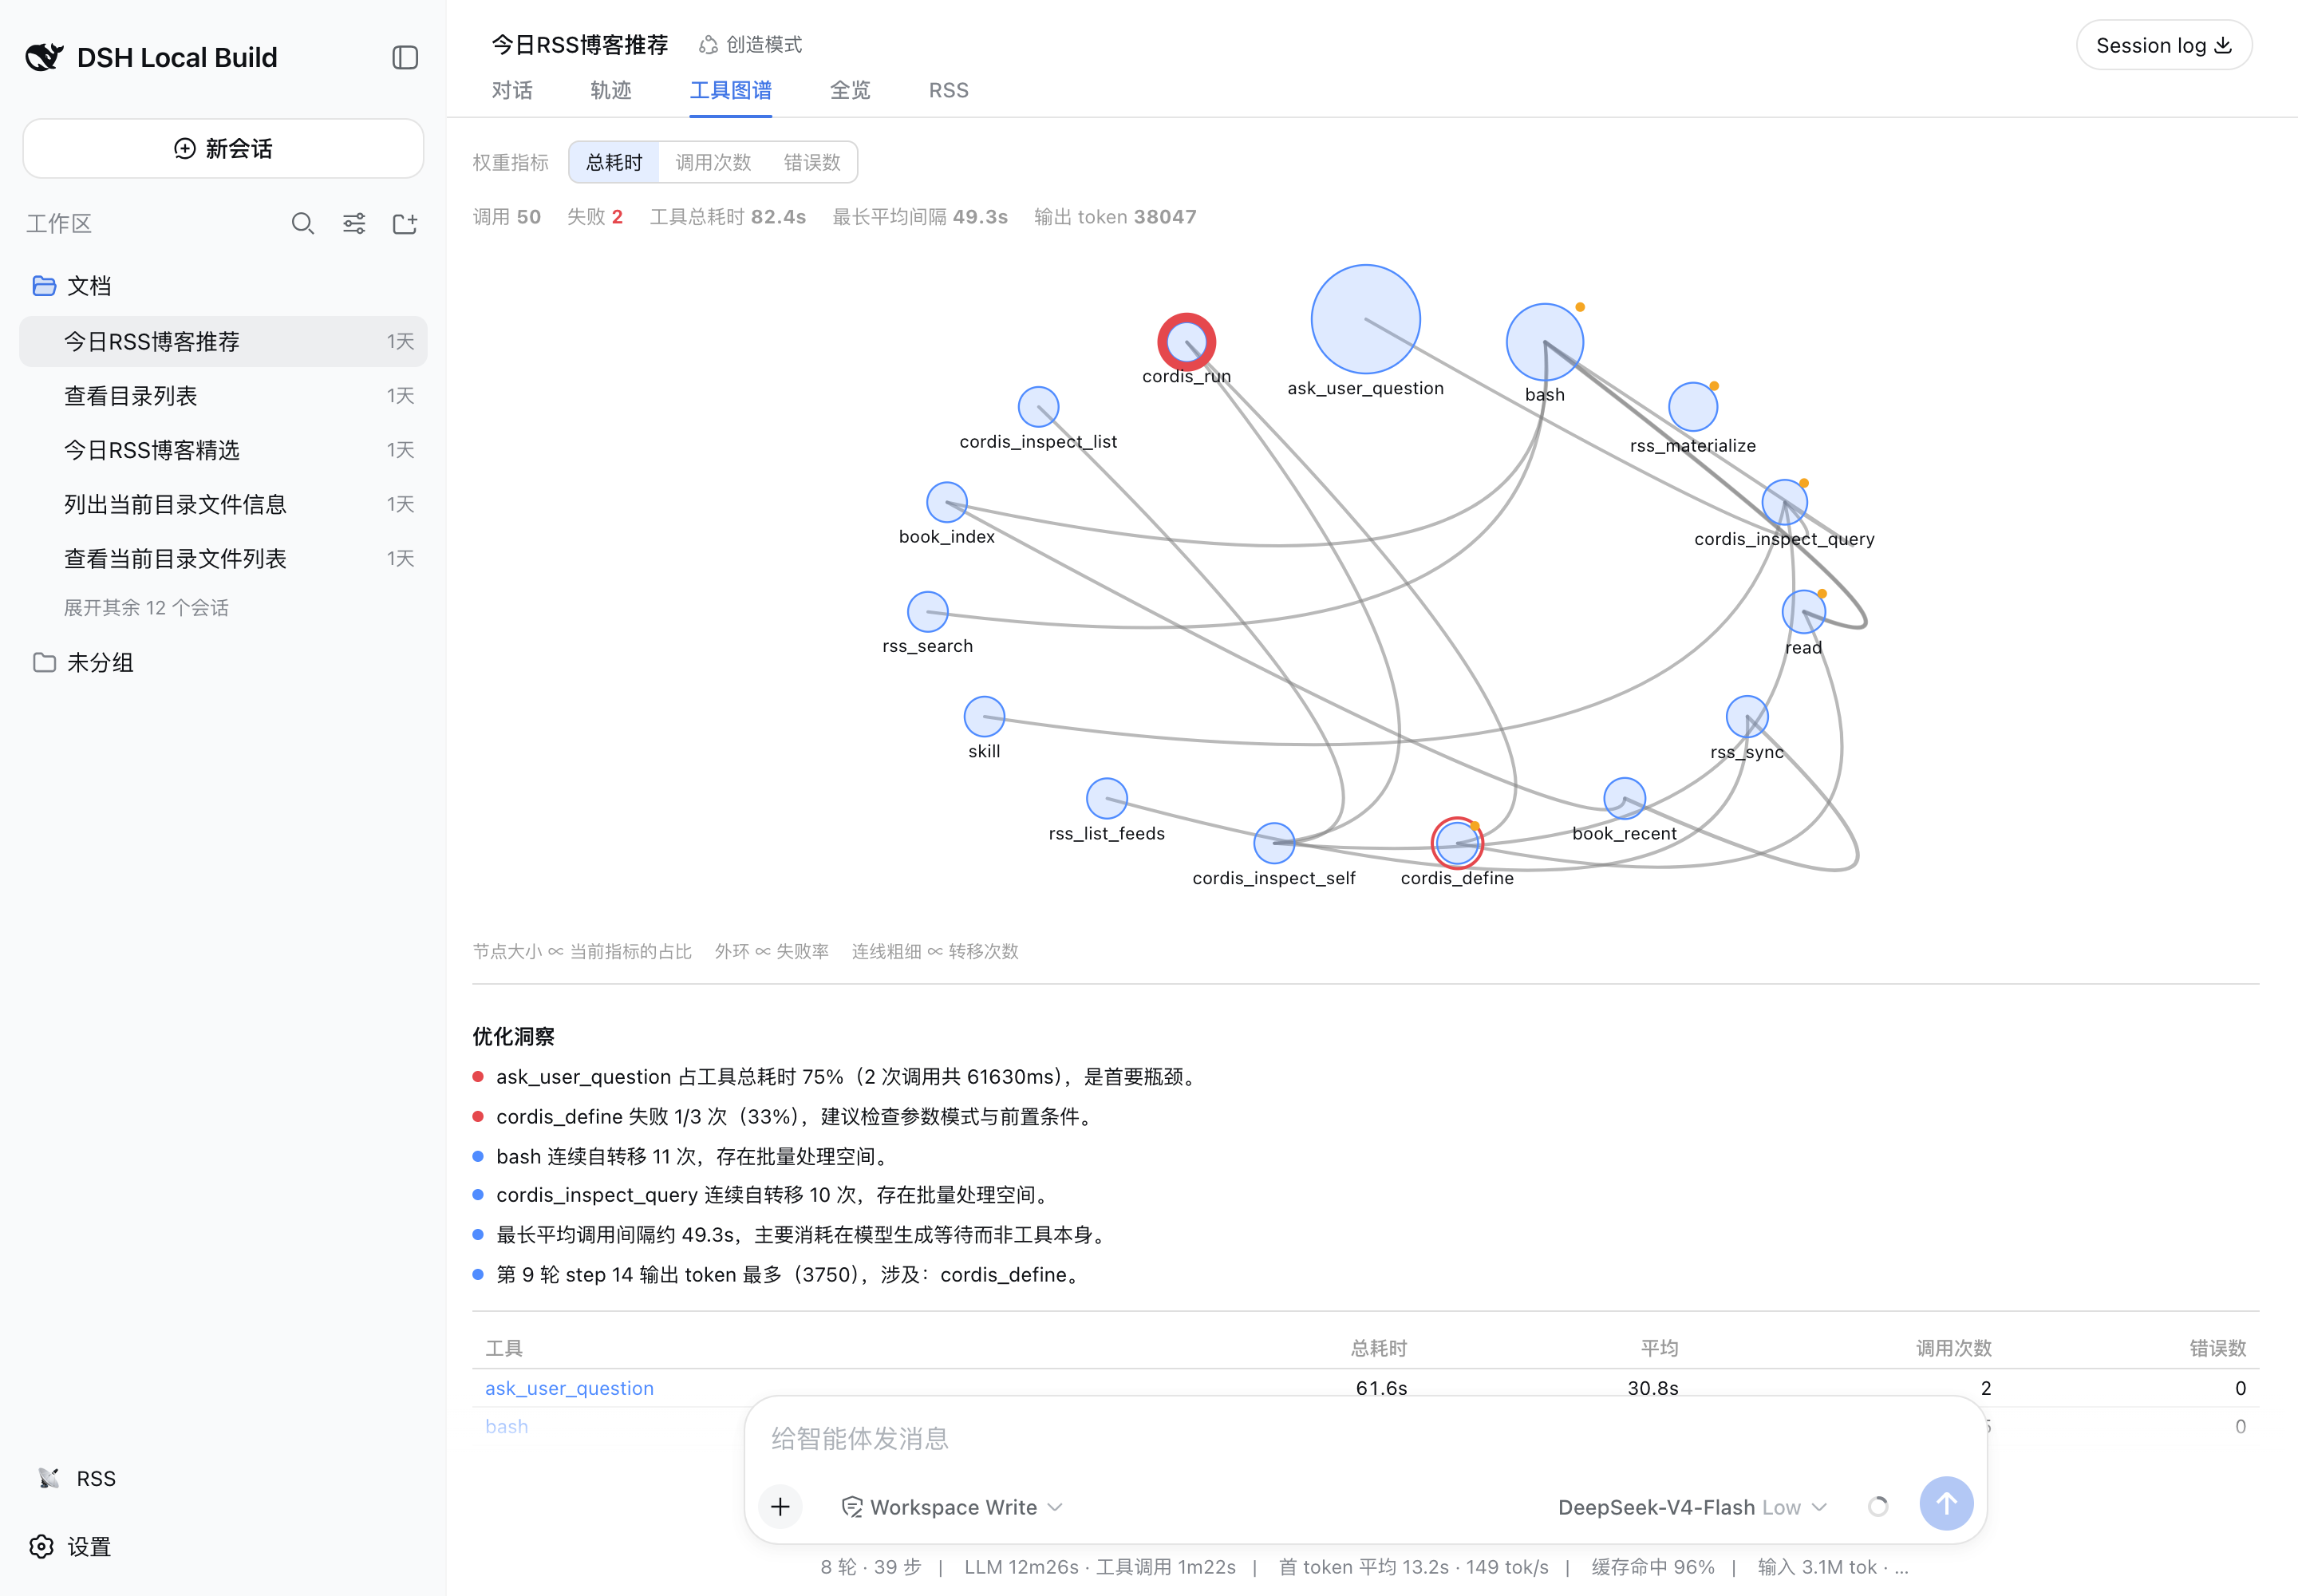
After an agent finishes a turn, its trajectory log hides a wealth of efficiency signals — which tool consumed the most wall time, which calls kept failing, how many tokens each round actually burned, which calls repeated themselves verbatim — yet no human can easily parse all of that from a raw event stream. dsh-ui-tool-graph folds the entire session log into a single weighted relationship graph, making tool-call economics visible at a glance with zero token cost, deterministic replay, and no extra model calls.
The core view is a radial weighted graph: nodes are tools, sized by whichever metric you pick (total duration, call count, or errors) with an outer ring proportional to error rate; edges are consecutive dispatch pairs within a turn, weighted by transition count. Above the graph, rule-derived insights surface the dominant bottleneck, error-prone tools, verbatim repeat calls (cache or dedup candidates), consecutive same-tool chains, model-generation waits, and the token-heaviest step, each tagged with a severity dot. A per-tool ranking table lets you drill into every individual call with its duration and argument excerpt, and a session-totals strip shows calls, failures, tool wall time, longest average gap, and output tokens.
Who it is for: any developer or operator driving agents through the dsh Web UI. When you want a clear answer on where this round was slow, repetitive, or optimizable, open the Tool Graph tab for a self-contained efficiency audit. You can even copy the generated analysis prompt to the clipboard or queue it as your next message, stepping straight into the optimization loop.
Screenshots
Use Cases
- Review which tool consumed the most wall time in an agent round
- Find verbatim repeat calls for cache or dedup optimization
- Generate a next-turn optimization prompt and queue it as the next message
Best For
- Developers driving agents through the dsh Web UI
- Operators needing to audit agent performance bottlenecks
- Tech leads focused on agent tool-call economics
Related Plugins
A service-oriented sidebar framework for DSH, offering a full workbench with file explorer, embedded browser, real terminal, Git panel, and extensible plugin services.

A beautiful, practical Claude Code-style TUI plugin with pixel whale top bar, flowing glow title, real-time status line, streaming thought expansion, time rewind, context progress bar and TPS gauge — zero core changes.

The plugin market for DeepSeek Harness: browse/search/one-click install community plugins and themes, with updates, backup/restore, hot disable, diagnostics, and AI fix.

A persistent whale widget on the DSH web UI that shows DeepSeek balance, today's usage, and per-turn cost, with drag-and-snap and sound effects.