zcode-usage-stats
Run the following command in DeepSeek Harness:
dsh plugin install qianxiao1213/zcode-usage-stats
Paste the following prompt into your AI chat to install this plugin:
Run dsh plugin install qianxiao1213/zcode-usage-stats inside DeepSeek Harness, then restart DSH and open the Settings page to see the usage dashboard; the full source is available at https://github.com/qianxiao1213/zcode-usage-stats .
About this plugin
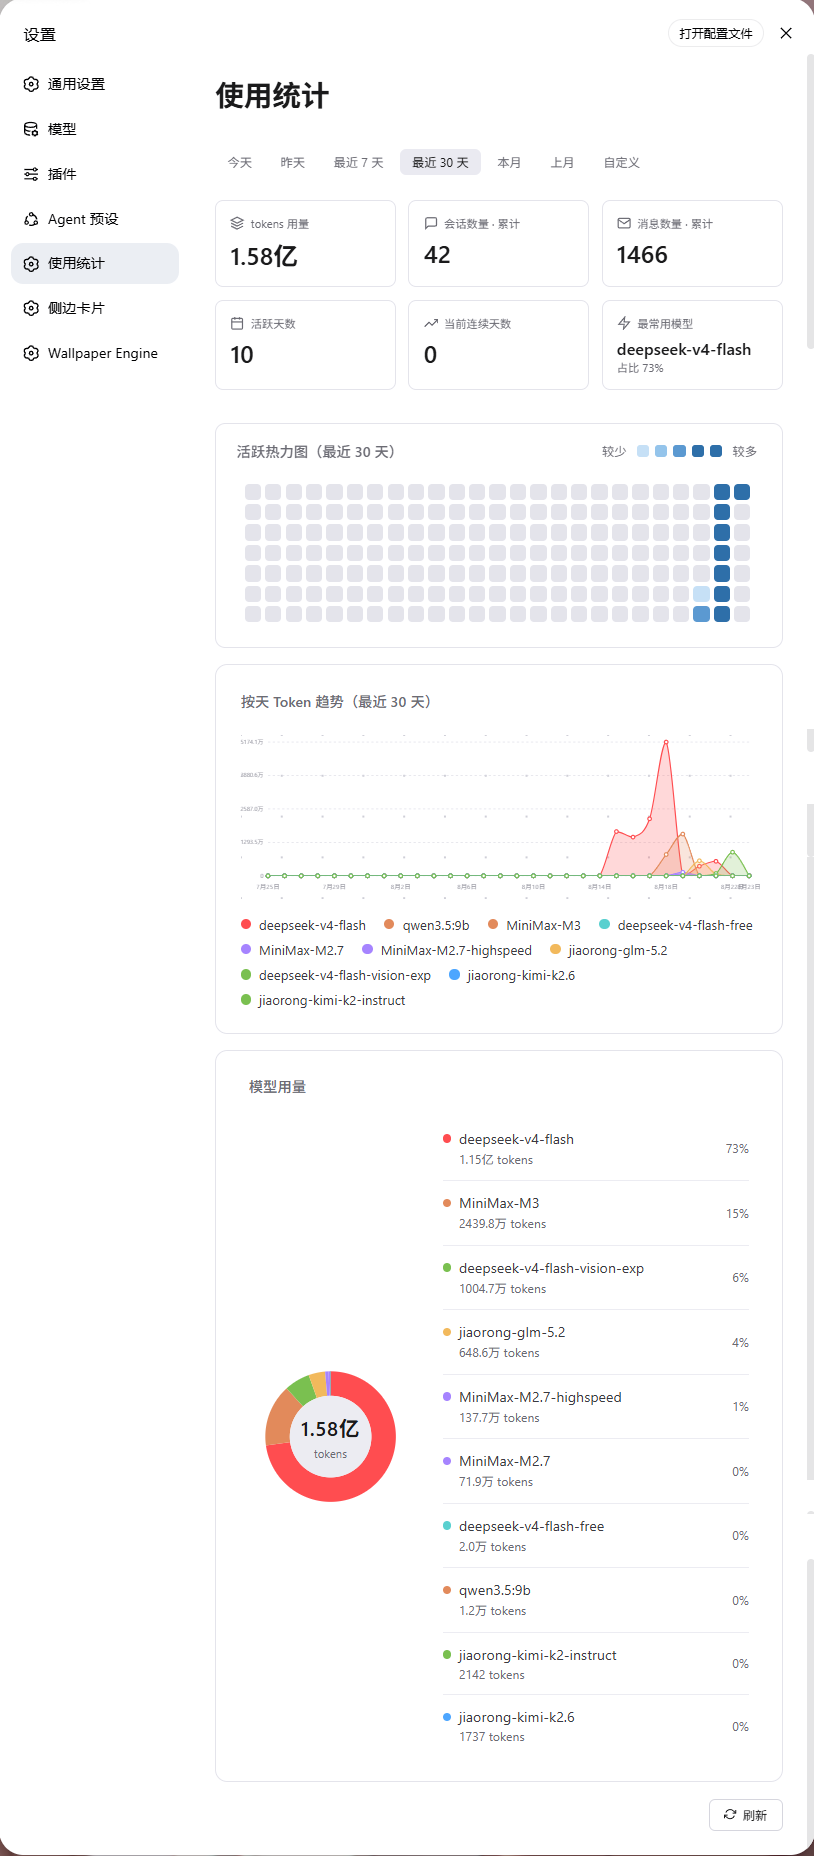
When you run multi-turn conversations in DeepSeek Harness, token spend can feel like a black box — how much went out each day, which model eats the most, where the peaks land. zcode-usage-stats puts a ready-made analytics dashboard right inside the DSH Settings page. It scans your full session history, aggregates token usage by day, by hour, and by model, then renders three views: a smooth multi-series area trend chart, a circular model-share gauge, and a GitHub-style activity heatmap. Time presets cover today, yesterday, last 7 days, last 30 days, this month, last month, and a fully custom range; when a single-day window is picked the x-axis automatically flips from days to hours.
The trend chart uses Catmull-Rom smoothing with reference lines, point-snap tooltips, and per-series legend toggles. The heatmap folds columns by window day and supports hover zoom with tooltips. Colors follow the DSH light or dark theme out of the box. Under the hood, a two-tier disk-plus-memory cache with stale-while-revalidate refresh keeps the first paint instant, while a bounded concurrency pool with timeout guards keeps scanning responsive even on large session libraries.
If you manage several models in DSH, need periodic token-cost reports, or just want a glanceable answer to what did I spend this week and on which model, this plugin slots into the Settings page with zero extra configuration.
Screenshots
Use Cases
- Track daily and hourly token consumption to spot usage peaks quickly
- Compare token share across models to inform model selection and cost decisions
- Review session activity patterns over a period with an interactive heat map
Best For
- DSH users who need to monitor token spend on a recurring basis
- Developers running multiple models and wanting a per-model cost breakdown
- Ops or team members who must present token usage reports to stakeholders
Related Plugins
A service-oriented sidebar framework for DSH, offering a full workbench with file explorer, embedded browser, real terminal, Git panel, and extensible plugin services.

A beautiful, practical Claude Code-style TUI plugin with pixel whale top bar, flowing glow title, real-time status line, streaming thought expansion, time rewind, context progress bar and TPS gauge — zero core changes.

The plugin market for DeepSeek Harness: browse/search/one-click install community plugins and themes, with updates, backup/restore, hot disable, diagnostics, and AI fix.

A persistent whale widget on the DSH web UI that shows DeepSeek balance, today's usage, and per-turn cost, with drag-and-snap and sound effects.