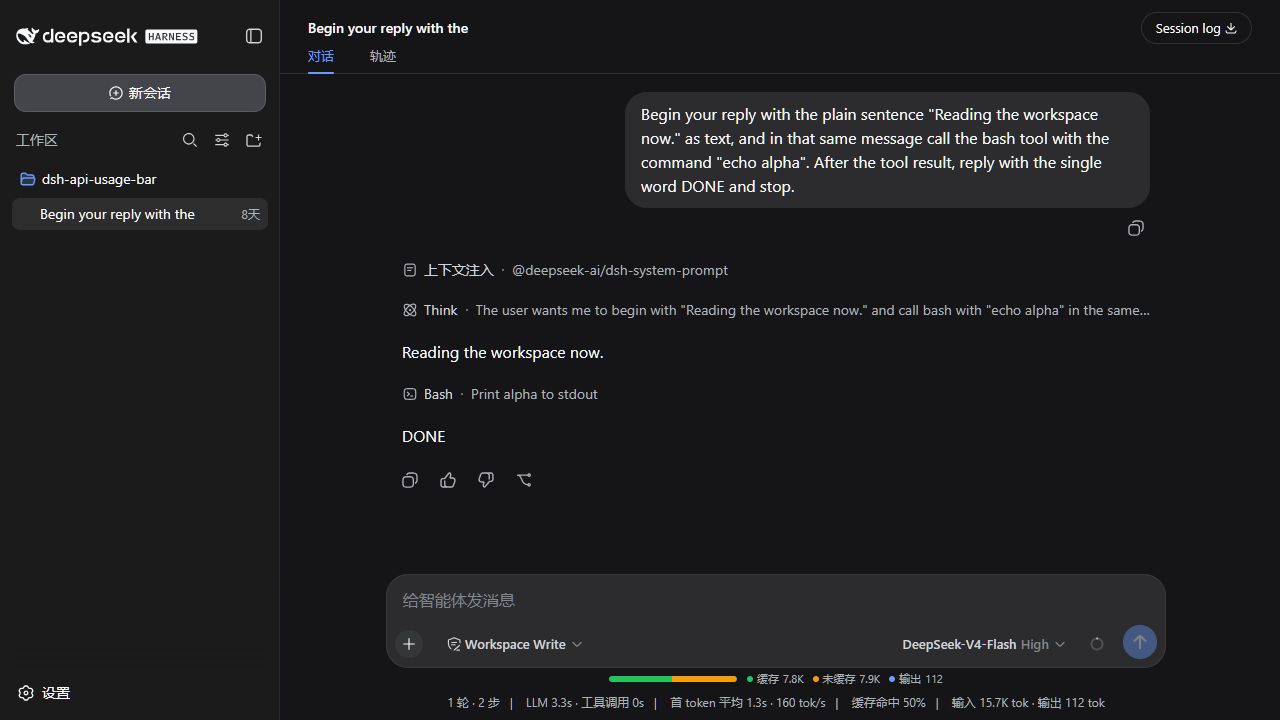
dsh-api-usage-bar
Run the following command in DeepSeek Harness:
dsh plugin install hurry060215-tech/dsh-api-usage-bar
Paste the following prompt into your AI chat to install this plugin:
Run dsh plugin install hurry060215-tech/dsh-api-usage-bar in PowerShell; the pre-built package is pulled from the GitHub Release at https://github.com/hurry060215-tech/dsh-api-usage-bar, and the usage bar will appear below the input box after restarting the DSH Web UI.
About this plugin
After a conversation in the DSH Web UI, you are usually shown a single cumulative token figure. How much of that came from cache hits, how much was uncached input, and how much was output often requires digging through logs. dsh-api-usage-bar condenses that into a three-segment color bar below the input box: green for cached reads, yellow for uncached input (including cache writes), and blue for output, with compact numbers beside it and precise per-segment counts on hover.
The bar renders entirely on the client side. It reads the tokenUsage session projection already present in the browser and makes no network requests, touches no API key, never queries account balance, and does not modify anything sent to the model. The three segments are normalized against total tokens, so the chart shows the usage composition of a single session rather than an account-quota gauge, and it will never fabricate a percentage against a non-existent denominator.
It adds no new model tools, changes no system prompt, and costs zero extra tokens. It is a pure visual aid layer, ideal for DeepSeek Harness developers who want to judge cache-hit ratios and usage structure at a glance without leaving the Web UI, particularly those who care about prompt-caching strategy and want a direct view of where tokens go.
Screenshots
Use Cases
- Assess cache-hit ratio and usage composition right after a turn
- Compare per-segment token ratios across different prompting strategies
- See three-color usage proportions at a glance on a narrow viewport
Best For
- DSH developers who optimize prompt-caching strategy
- Engineers who want token-flow clarity without reading raw logs
- Everyday DSH Web UI users who need a clear usage-composition readout
Related Plugins
A service-oriented sidebar framework for DSH, offering a full workbench with file explorer, embedded browser, real terminal, Git panel, and extensible plugin services.

A beautiful, practical Claude Code-style TUI plugin with pixel whale top bar, flowing glow title, real-time status line, streaming thought expansion, time rewind, context progress bar and TPS gauge — zero core changes.

The plugin market for DeepSeek Harness: browse/search/one-click install community plugins and themes, with updates, backup/restore, hot disable, diagnostics, and AI fix.

A persistent whale widget on the DSH web UI that shows DeepSeek balance, today's usage, and per-turn cost, with drag-and-snap and sound effects.