dsh-token-usage-dashboard
Run the following command in DeepSeek Harness:
dsh plugin install solstice621/dsh-token-usage-dashboard
Paste the following prompt into your AI chat to install this plugin:
Run dsh plugin install solstice621/dsh-token-usage-dashboard in the DeepSeek Harness terminal to install the plugin from its source at https://github.com/solstice621/dsh-token-usage-dashboard
About this plugin
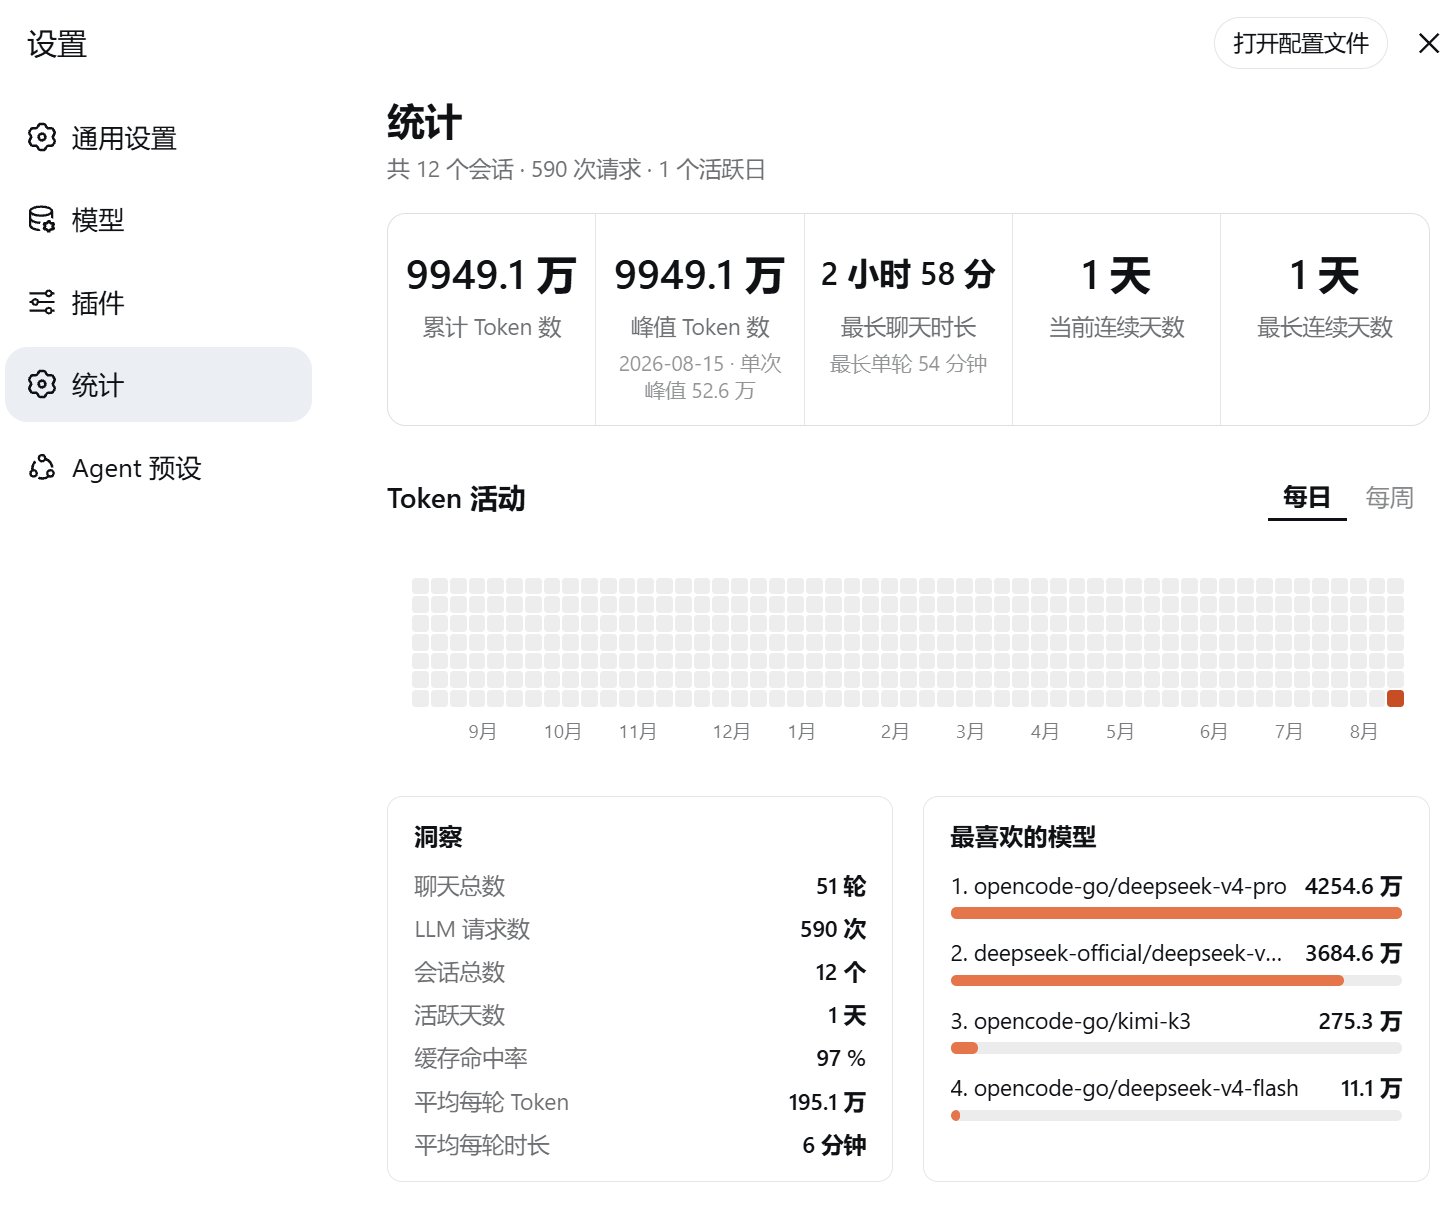
After weeks of daily coding in DeepSeek Harness, you probably want to know exactly how many tokens you spent this week, which model consumed the most, and how long your current active streak is. dsh-token-usage-dashboard folds the usage data scattered across session logs into a single Codex-style dashboard, so you get answers at a glance instead of grepping through JSON files.
Open Settings → Stats and you will find five stat cards (total tokens, single-day peak, longest chat, current and longest streaks), a 53×7 GitHub-style heatmap with a daily/weekly toggle (hover reveals the exact date, token count, and request count), seven insight rows covering cache hit rate and average per-turn tokens and duration, and a Top-5 model ranking with proportional bars. Everything updates in real time via incremental event streaming; on restart the plugin loads a local snapshot and folds only new events, so the dashboard is ready in seconds. The interface follows your DSH language setting and relabels instantly on a Chinese/English switch without a page refresh.
It is designed for individual developers who rely on Harness heavily, small teams that want to keep an eye on token budgets, and anyone curious about cross-usage comparisons across models. Plugin maintainers in the DSH ecosystem will also appreciate the included dynamic cordis_define deployment path, which lets you iterate on dashboard logic without restarting the profile.
Screenshots
Use Cases
- Quickly review weekly token consumption trends after daily coding
- Compare usage distribution across multiple models to spot high-spend scenarios
- Monitor token budget consumption in a team setting
Best For
- Individual developers who rely heavily on DeepSeek Harness
- Small to mid teams tracking token budgets
- Tech leads optimizing model selection and usage
Related Plugins
A service-oriented sidebar framework for DSH, offering a full workbench with file explorer, embedded browser, real terminal, Git panel, and extensible plugin services.

A beautiful, practical Claude Code-style TUI plugin with pixel whale top bar, flowing glow title, real-time status line, streaming thought expansion, time rewind, context progress bar and TPS gauge — zero core changes.

The plugin market for DeepSeek Harness: browse/search/one-click install community plugins and themes, with updates, backup/restore, hot disable, diagnostics, and AI fix.

A persistent whale widget on the DSH web UI that shows DeepSeek balance, today's usage, and per-turn cost, with drag-and-snap and sound effects.