dsh-usage-insights
Run the following command in DeepSeek Harness:
dsh plugin install fazhu4/dsh-usage-insights
Paste the following prompt into your AI chat to install this plugin:
Run dsh plugin install fazhu4/dsh-usage-insights inside DeepSeek Harness to add this plugin; the full source repository lives at https://github.com/fazhu4/dsh-usage-insights
About this plugin
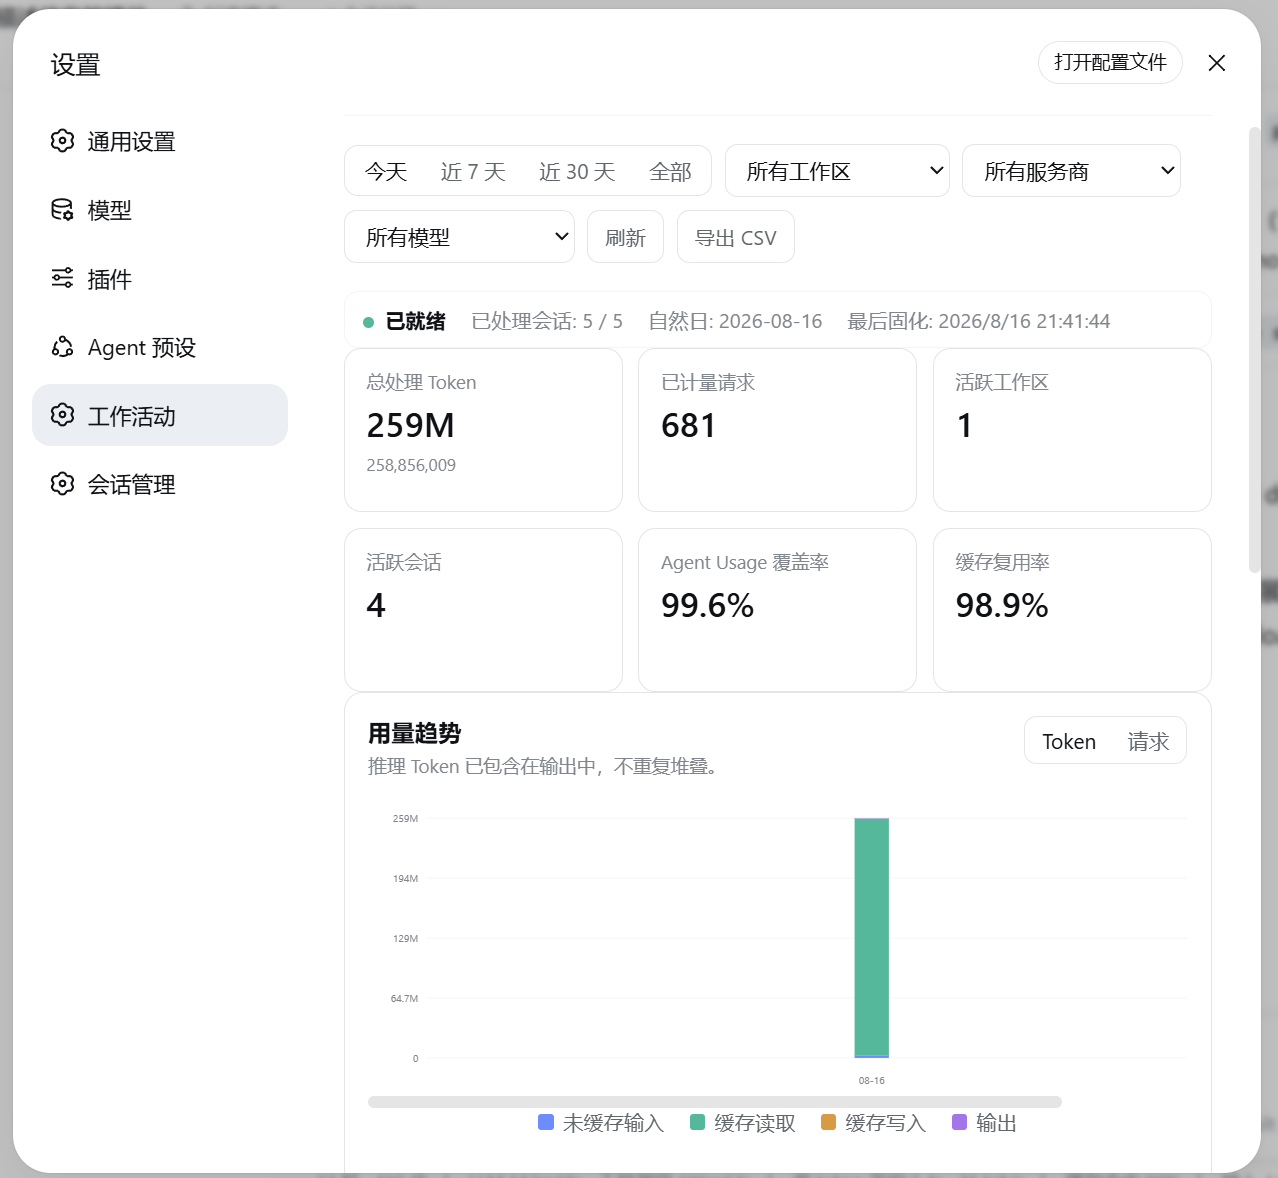
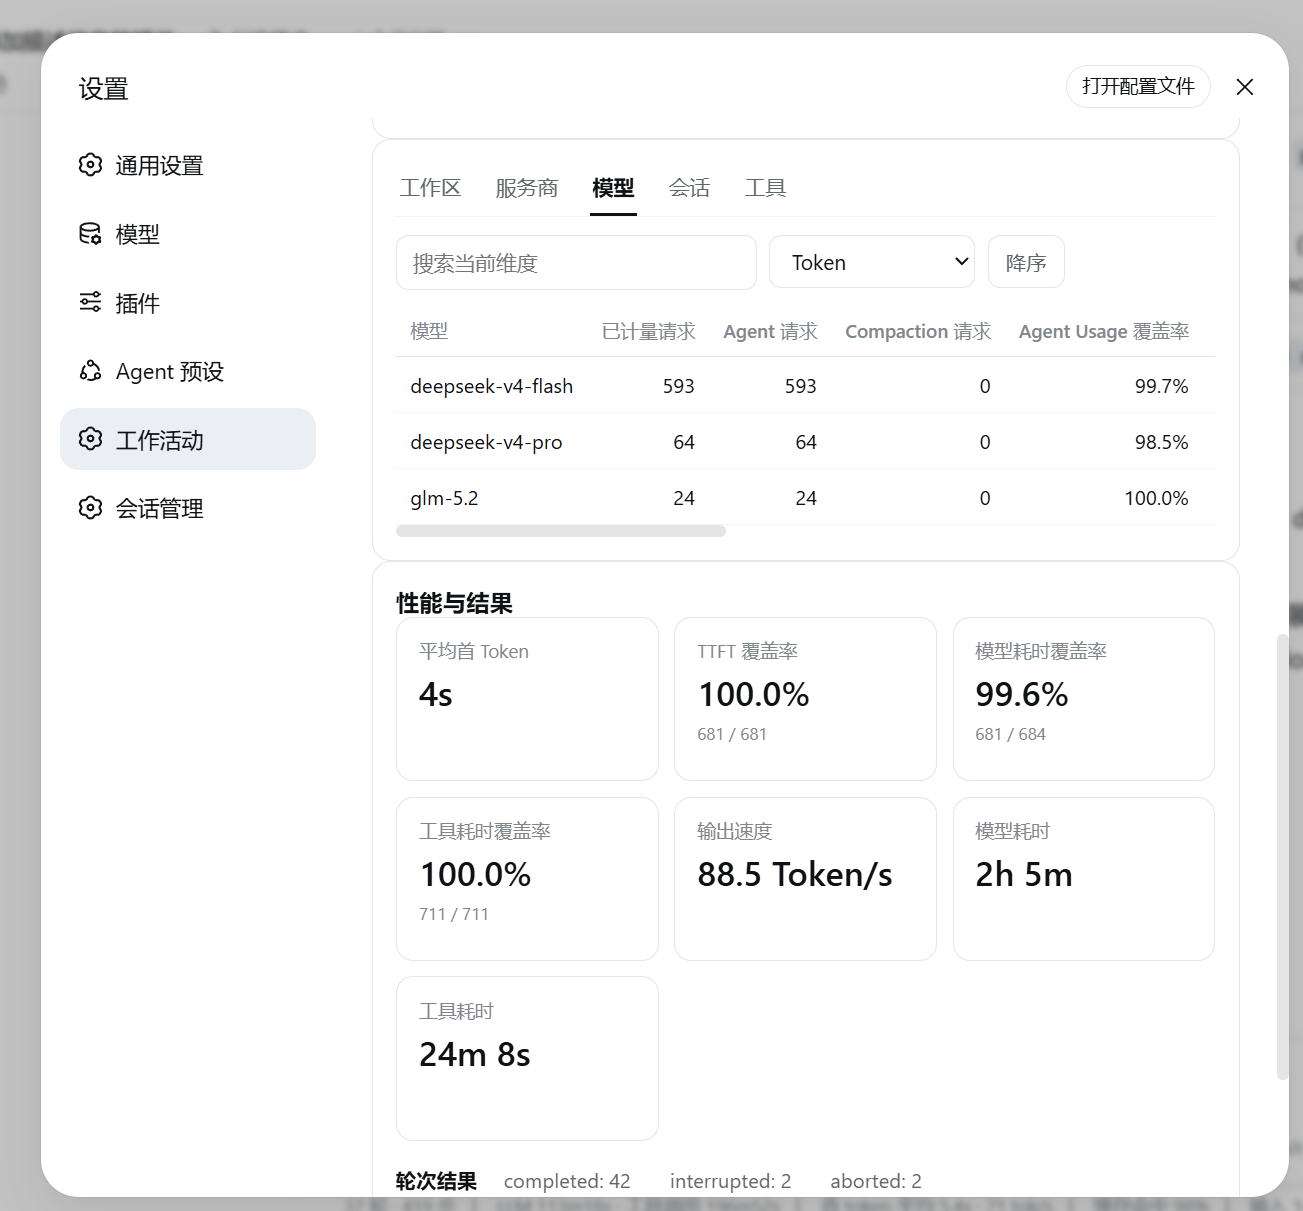
Working inside DeepSeek Harness leaves a lot of key questions unanswered out of the box: how many Agent turns actually completed, how many tool calls fired, whether tokens went into uncached input or cache reads, and whether caching is pulling its weight at all. Those signals are buried in raw session events, and log-parsing by hand is both slow and error-prone. dsh-usage-insights aggregates that scattered data into a local, read-only work-activity dashboard. Slice by today, the last 7 days, the last 30 days, or the full history, then cross-filter along workspace, provider, and model to inspect uncached input, cache reads, cache writes, output, and reasoning tokens side by side, while tracking metered requests, Agent Usage coverage, model and tool latency, TTFT coverage, cache reuse rate, and daily tool-failure trends. Five paginated breakdowns (workspace, provider, model, session, tool) all support search, sorting, and CSV export so the numbers feed straight into downstream spreadsheets.
The plugin stays deliberately restrained. It never displays monetary amounts, never calls a model or provider API, and never reads prompts, replies, tool parameters, or tool output. Every metric is derived locally from DSH session events: per-session atomic writes, watermark-based deduplication so no event is double-counted, a backfill buffer that merges real-time and replayed events by sequence number, and session-level isolation so a single unreadable record cannot block the rest. When the timezone or aggregation algorithm version changes, the old derived cache is discarded entirely and rebuilt from raw events rather than blended with a different statistical baseline. Removing a source session only cleans up the plugin's own derived records; original DSH conversation data is never modified or deleted.
If you are running Agent workflows across multiple workspaces, providers, and models in DeepSeek Harness and need to audit usage periodically, hunt down latency hotspots, or report cost structure to a team, this dashboard replaces the manual log-parsing ritual with a single page refresh. It will not make decisions for you, but it puts the numbers those decisions depend on clearly on the table.
Screenshots
Use Cases
- Cross-filter by workspace, provider, and model to audit token usage and cache-reuse across multi-model Agent workflows
- Pinpoint latency bottlenecks via TTFT, model/tool elapsed time, and daily tool-failure trends, then adjust calling strategies
- Export a CSV matching the current filter set for team weekly reports, cost allocation, or usage-audit archives
Best For
- Engineers running multi-provider, multi-model Agent workflows inside DeepSeek Harness
- Tech leads who need to report usage and cost structure to their team on a cadence
- Platform managers who want to audit usage without ever touching raw prompt or reply content
Related Plugins
A service-oriented sidebar framework for DSH, offering a full workbench with file explorer, embedded browser, real terminal, Git panel, and extensible plugin services.

A beautiful, practical Claude Code-style TUI plugin with pixel whale top bar, flowing glow title, real-time status line, streaming thought expansion, time rewind, context progress bar and TPS gauge — zero core changes.

The plugin market for DeepSeek Harness: browse/search/one-click install community plugins and themes, with updates, backup/restore, hot disable, diagnostics, and AI fix.

A persistent whale widget on the DSH web UI that shows DeepSeek balance, today's usage, and per-turn cost, with drag-and-snap and sound effects.