dsh-usage-dashboard
Run the following command in DeepSeek Harness:
dsh plugin install Cassius0924/dsh-usage-dashboard
Paste the following prompt into your AI chat to install this plugin:
Run dsh plugin install Cassius0924/dsh-usage-dashboard in your terminal and restart your DSH web instance to complete installation, with the full source code available at https://github.com/Cassius0924/dsh-usage-dashboard, after which the usage tab will appear in any active session.
About this plugin
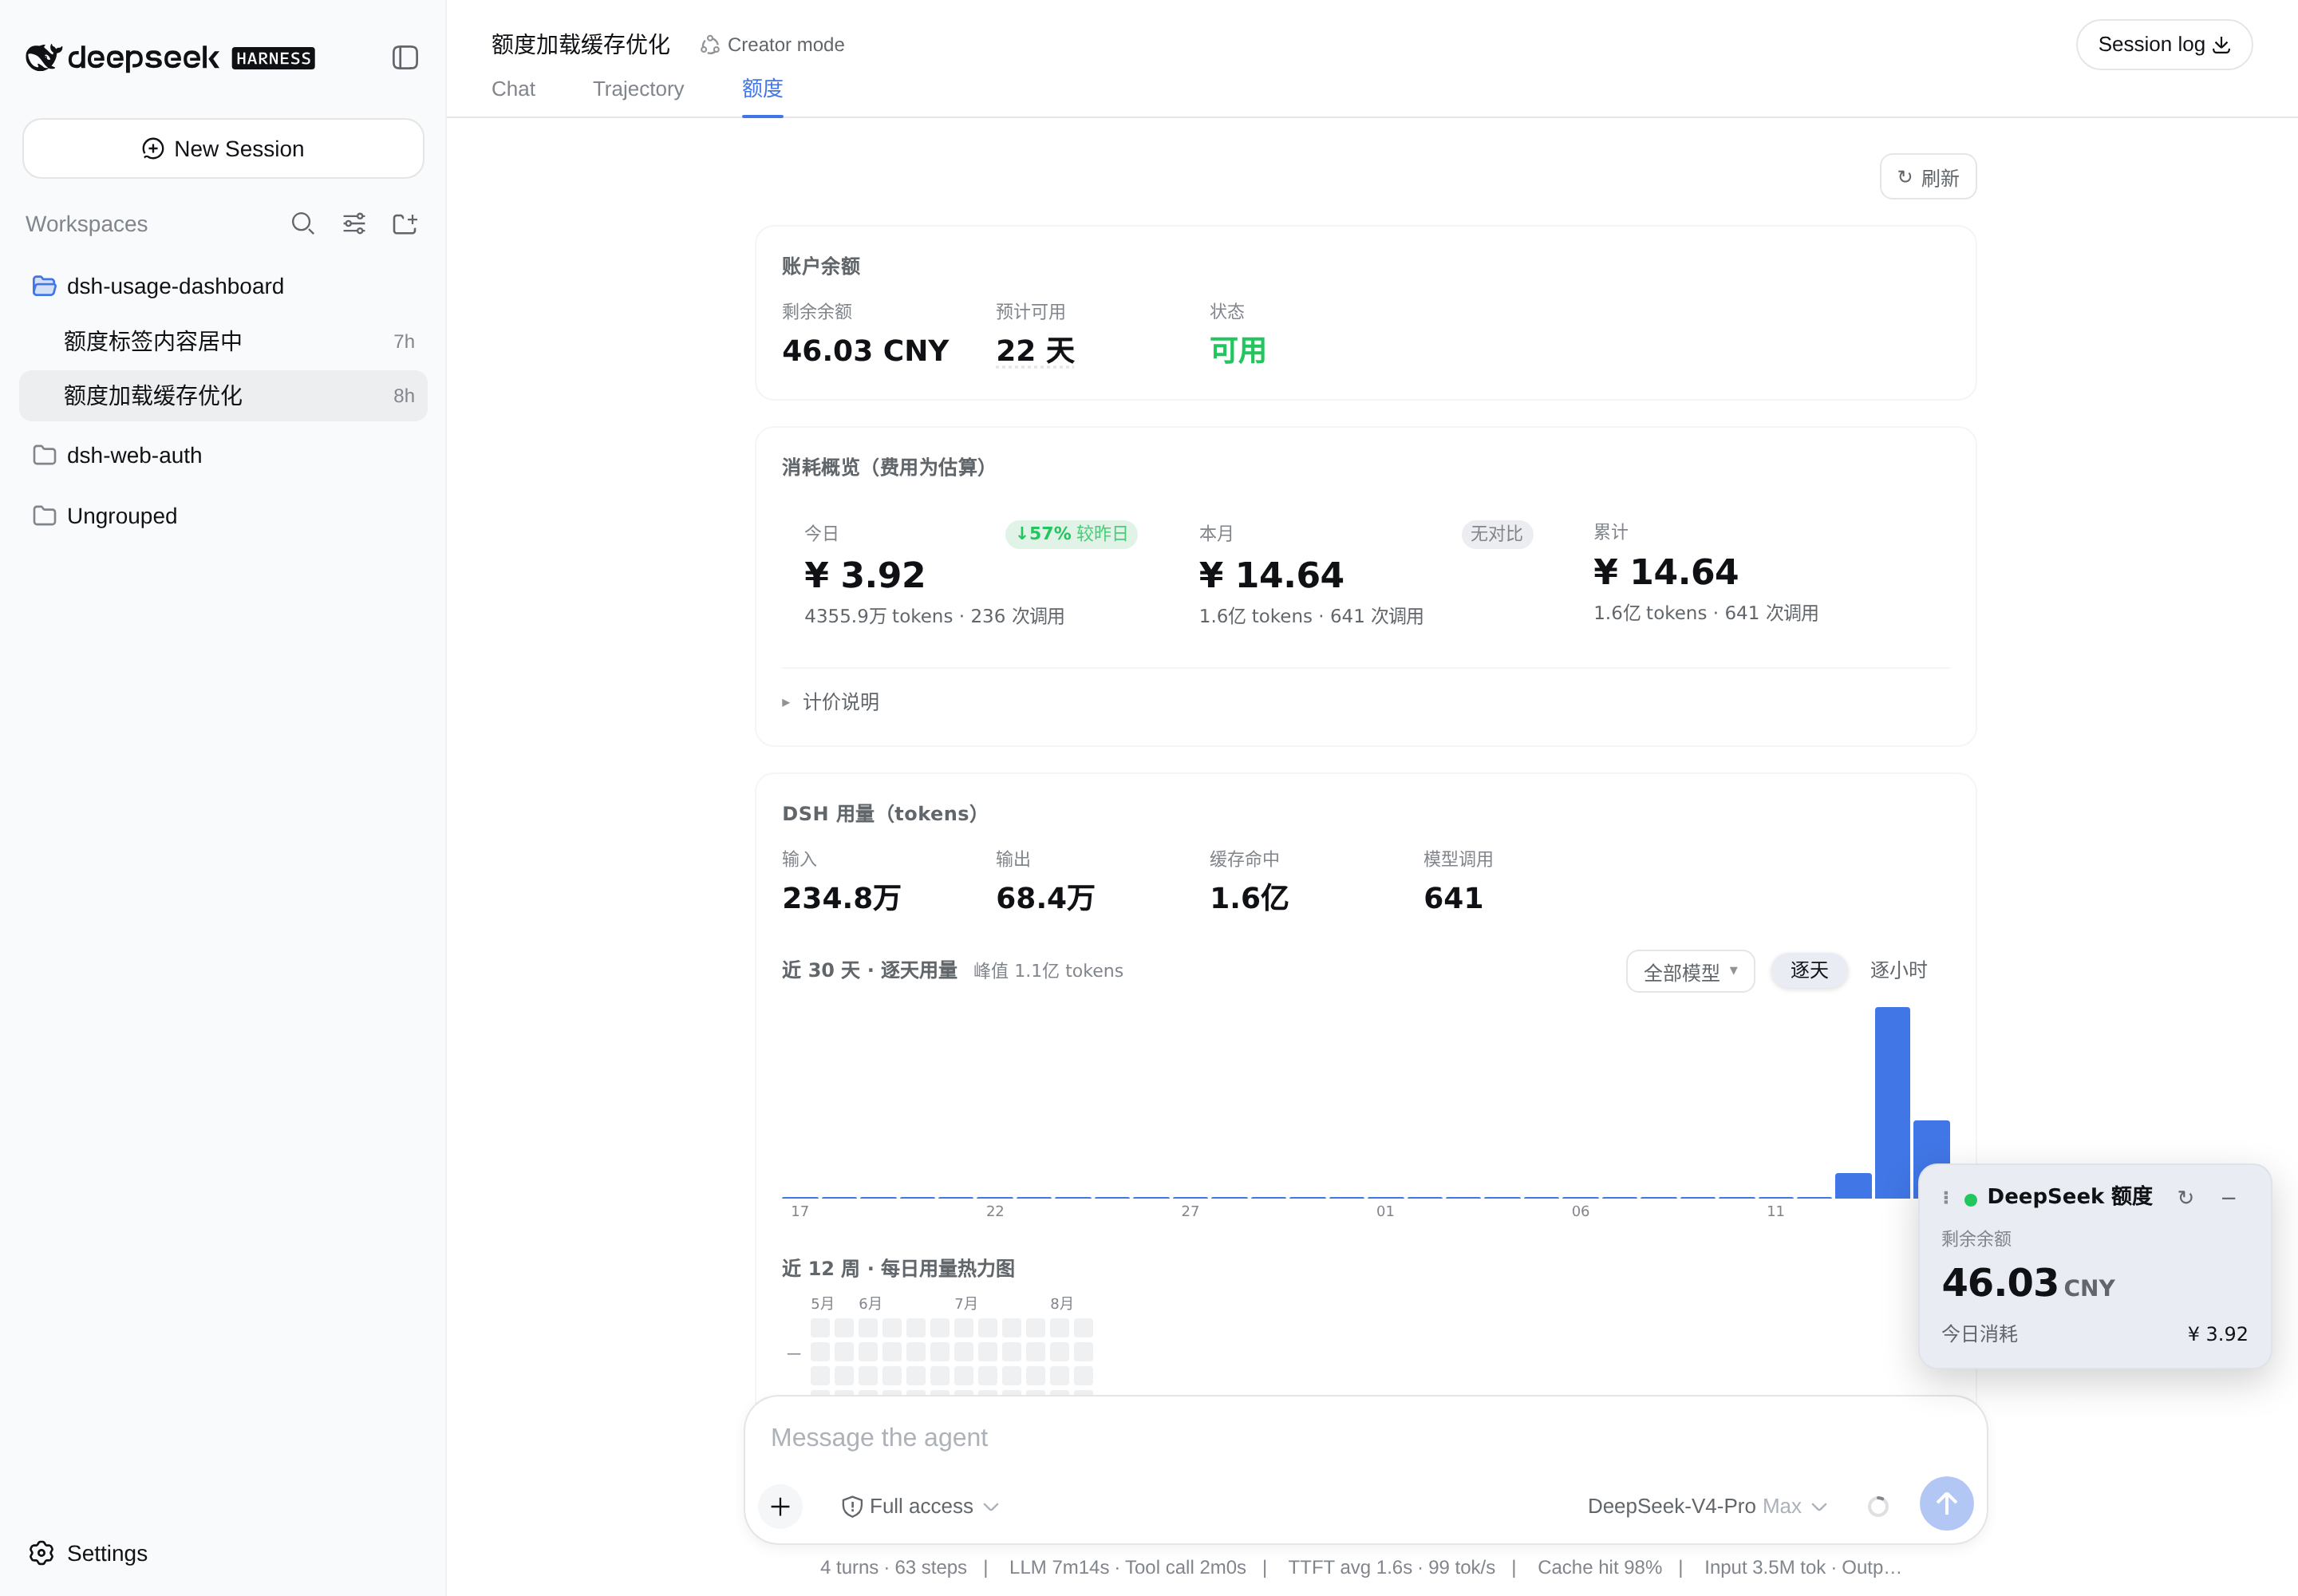
Running automated agents or long-running workflows in DSH often means watching your API budget evaporate quietly behind the scenes. The default interface leaves you with just a static balance number, offering no insight into daily burn rates, model-specific costs, or how much prefix caching is actually saving you. With DeepSeek’s shift to dynamic peak/off-peak pricing, trying to manually forecast how your next bill will look quickly turns into a spreadsheet nightmare.
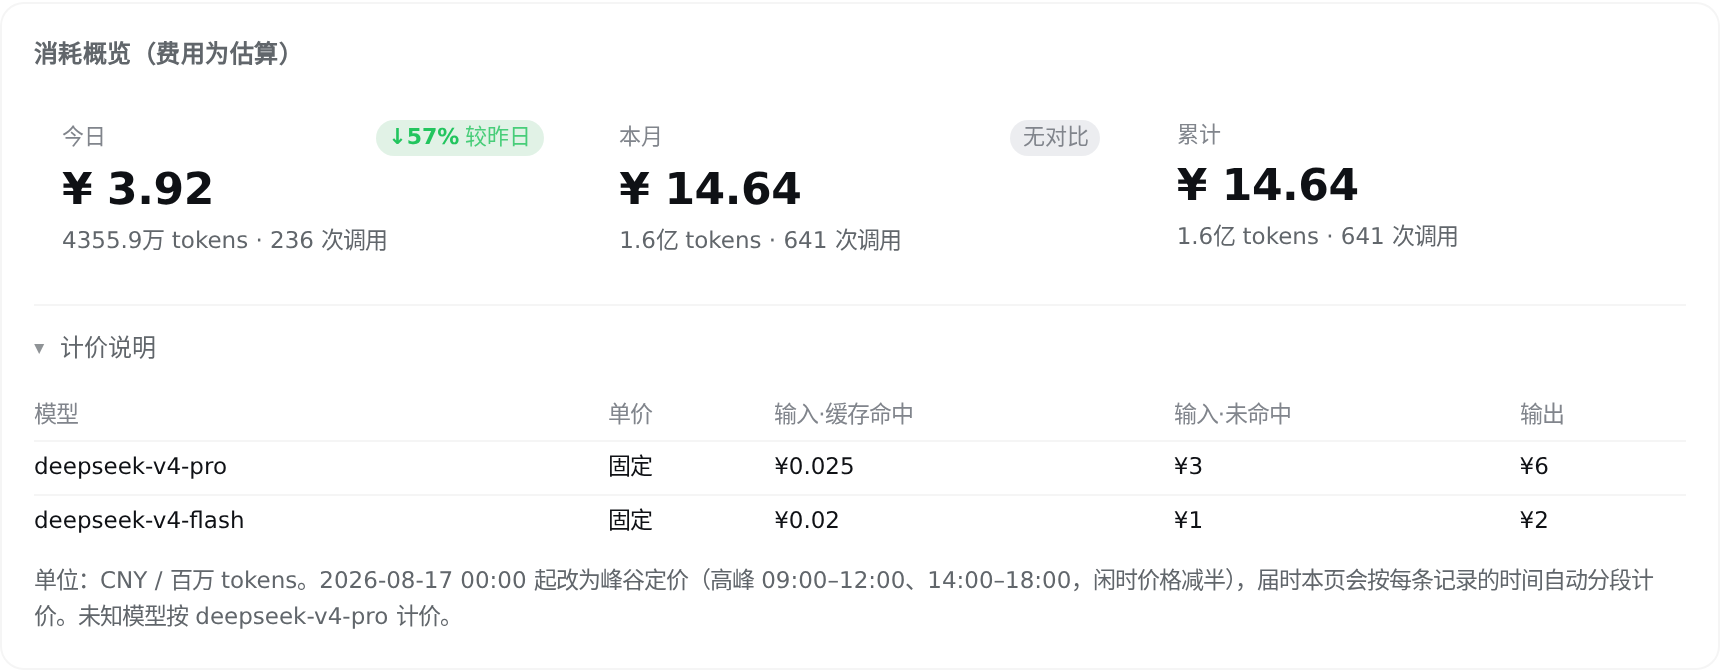
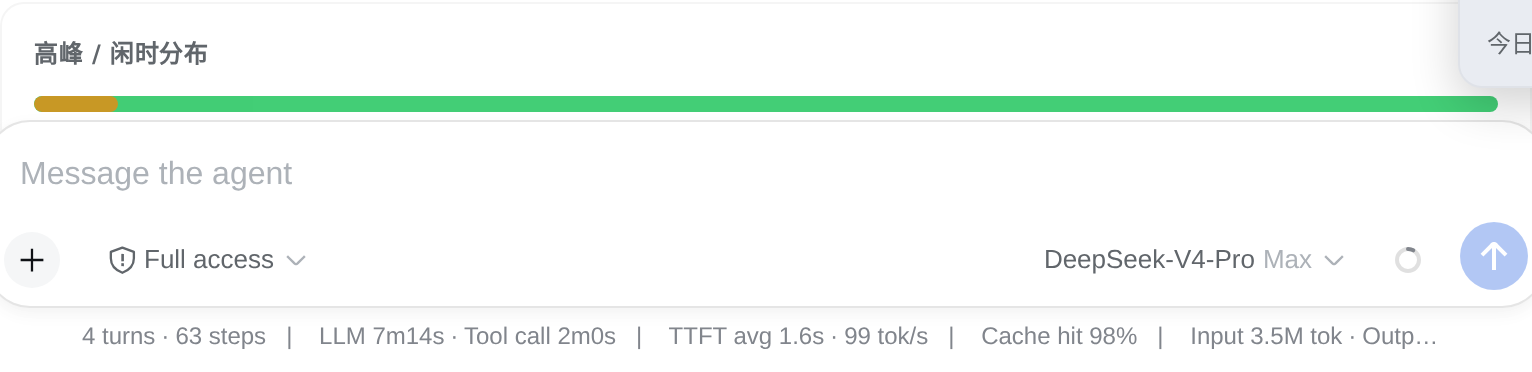
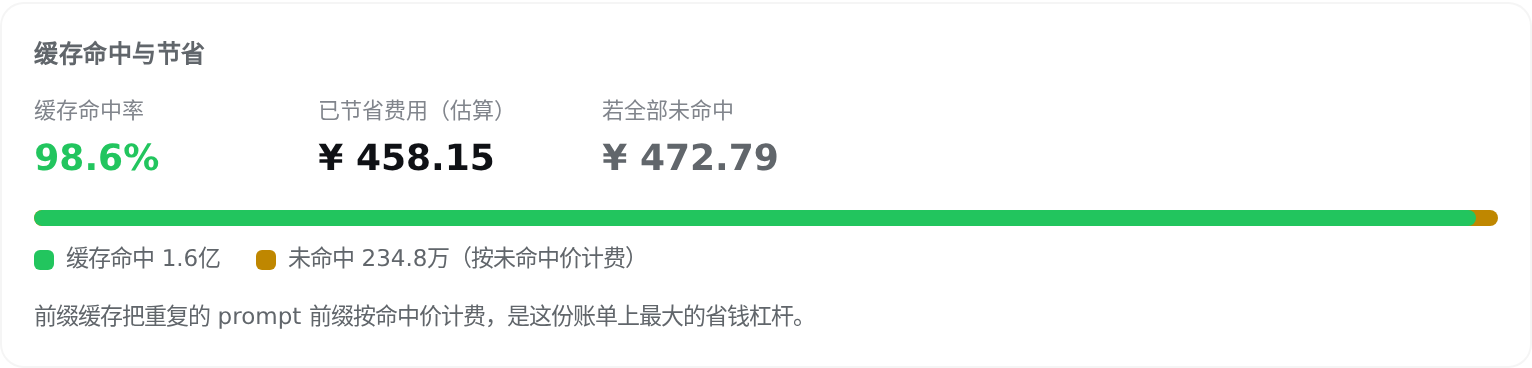
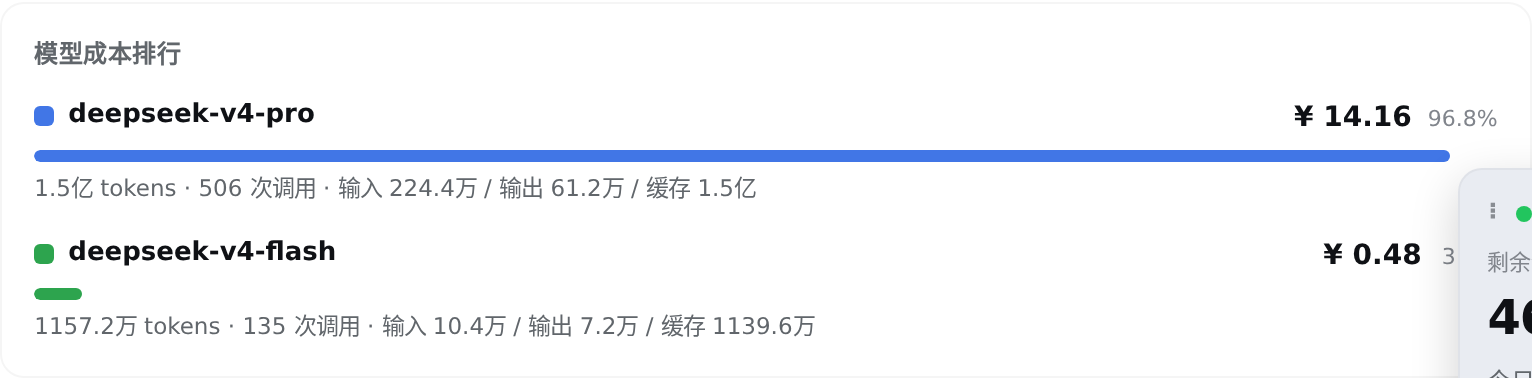
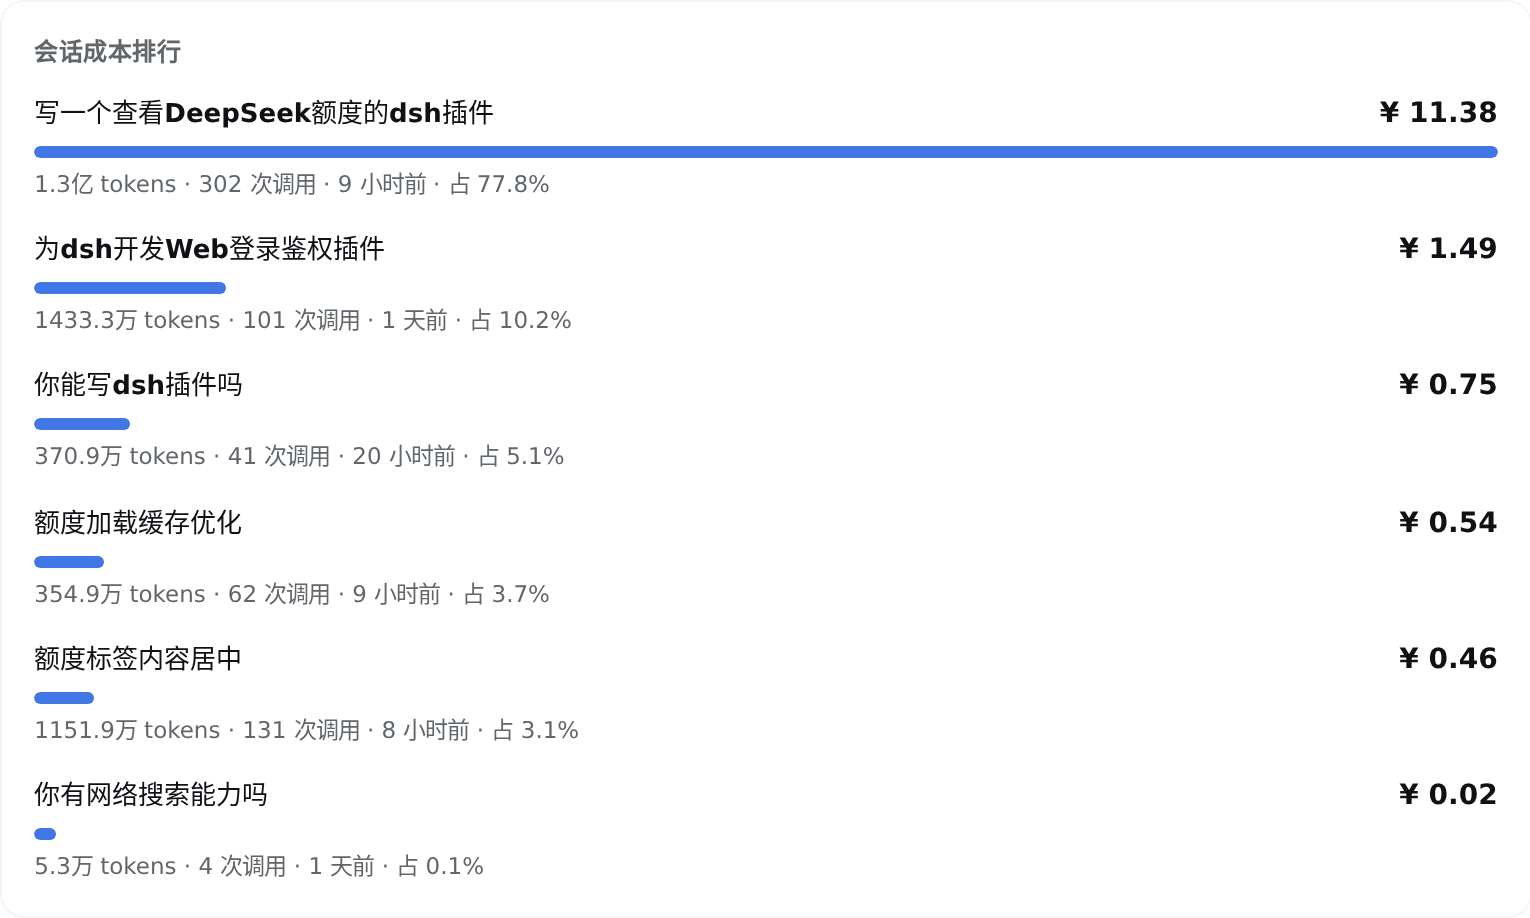
dsh-usage-dashboard bridges this gap by transforming raw usage logs into an intuitive, real-time spending cockpit. A draggable floating widget keeps your current balance and daily consumption at a glance, while the dedicated Usage tab delivers deep analytical insights. You can track remaining days of funding, view day-over-day and month-over-month spend comparisons, and break down expenses by model or conversation. The plugin also natively supports the August 17, 2026 peak/off-peak pricing structure, projecting future bills and estimating potential savings from shifting workloads to off-peak hours. Additionally, it highlights your most expensive sessions and monitors cache hit rates, providing actionable tips whenever performance drops. All calculations are transparent, locally sourced, and based on openly documented pricing tiers.
This plugin is built for DSH power users, agent developers, and teams who need precise visibility over their LLM infrastructure costs. If you want to eliminate billing anxiety, optimize prompt reuse through caching, and make informed decisions about workload scheduling, this dashboard gives you the clarity needed to run AI workflows efficiently and affordably. Simply restart DSH after installation and take full control of your API spending.
Screenshots


Use Cases
- Monitor daily API burn rate during high-concurrency agent runs to prevent unexpected balance depletion.
- Use the built-in simulator to project new billing impacts after pricing updates and optimize task scheduling.
- Pinpoint the most expensive conversations when investigating sudden cost spikes to debug inefficient prompts or loops.
Best For
- Developers building automated workflows or AI agents who need precise control over their LLM budgets.
- Technical leads managing team resources who require transparent visibility into API spending and resource allocation.
- AI operations specialists focused on maximizing prompt reuse, cache efficiency, and overall inference cost optimization.
Related Plugins
A service-oriented sidebar framework for DSH, offering a full workbench with file explorer, embedded browser, real terminal, Git panel, and extensible plugin services.

A beautiful, practical Claude Code-style TUI plugin with pixel whale top bar, flowing glow title, real-time status line, streaming thought expansion, time rewind, context progress bar and TPS gauge — zero core changes.

The plugin market for DeepSeek Harness: browse/search/one-click install community plugins and themes, with updates, backup/restore, hot disable, diagnostics, and AI fix.

A persistent whale widget on the DSH web UI that shows DeepSeek balance, today's usage, and per-turn cost, with drag-and-snap and sound effects.