dsh-usage-stats-plus
Run the following command in DeepSeek Harness:
dsh plugin install Nixz0824/dsh-usage-stats-plus
Paste the following prompt into your AI chat to install this plugin:
Open a terminal inside DeepSeek Harness and run dsh plugin install Nixz0824/dsh-usage-stats-plus to install the plugin, sourced from https://github.com/Nixz0824/dsh-usage-stats-plus ; after installation, reload the browser page to see the usage and balance panel in the sidebar.
About this plugin
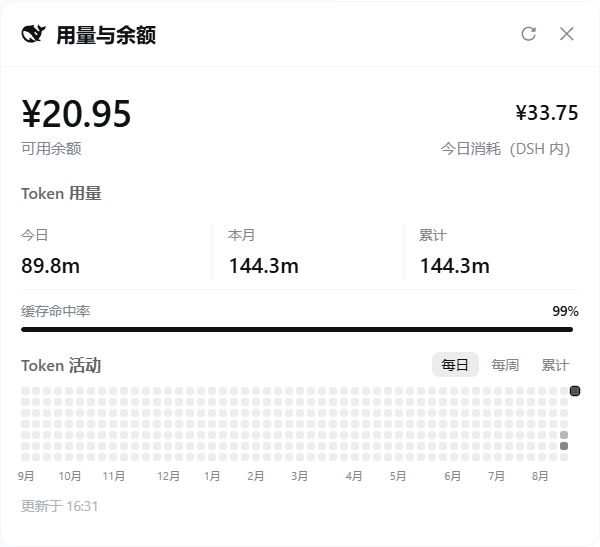
The default DSH usage panel typically shows a rough local estimate that neither reflects the official peak-and-off-peak rate table nor reveals spend on the website, the mobile app, or any other client, so the numbers rarely line up with your Open Platform invoice. dsh-usage-stats-plus replaces that estimate with a live pull from the official balance API, bills every usage sample individually against the official rate sheet, and adds a day-over-day snapshot diff to capture all-channel consumption—the figures you see can be cross-checked line by line against your bill.
Three capabilities set this fork apart. First, a per-event pricing engine that matches each sample to the correct peak or off-peak rate in Beijing time, bills cache writes at the input-miss rate, and applies replace semantics so duplicate reports for the same turn:step are subtracted and re-added rather than double-counted. Second, a Codex-style token activity timeline: a rolling twelve-month grid of 51 to 53 week columns with quantile shading, switchable between Daily, Weekly, and Cumulative views, giving an at-a-glance sense of usage rhythm. Third, an all-channel spend estimate built from official balance snapshots—the only figure that covers every entry point and reconciles with the Open Platform invoice. The interface uses a single ink monochrome palette traceable to the official DeepSeek whale mark, adapts to light and dark themes, and introduces no new runtime dependencies; the entire panel ships as a hand-written plain-JS bundle.
If you run a meaningful volume of DeepSeek calls, care about exactly where every token of spend lands, and want panel numbers you can verify against your invoice, this plugin is built for that workflow. It leaves DSH API routes and interaction logic untouched; a browser page refresh after install is all that is needed.
Screenshots
Use Cases
- Check DSH token usage and official balance at a glance
- Cross-reference per-event peak/off-peak pricing against the Open Platform invoice
- Trace a rolling twelve-month usage rhythm and trend
Best For
- Developers making high-volume DeepSeek API calls
- Tech leads who need precise cost reconciliation
- AI practitioners focused on API cost optimization
Related Plugins
A service-oriented sidebar framework for DSH, offering a full workbench with file explorer, embedded browser, real terminal, Git panel, and extensible plugin services.

A beautiful, practical Claude Code-style TUI plugin with pixel whale top bar, flowing glow title, real-time status line, streaming thought expansion, time rewind, context progress bar and TPS gauge — zero core changes.

The plugin market for DeepSeek Harness: browse/search/one-click install community plugins and themes, with updates, backup/restore, hot disable, diagnostics, and AI fix.

A persistent whale widget on the DSH web UI that shows DeepSeek balance, today's usage, and per-turn cost, with drag-and-snap and sound effects.