deepseek-harness-token
Run the following command in DeepSeek Harness:
dsh plugin install zoyluoblue/deepseek-harness-token
Paste the following prompt into your AI chat to install this plugin:
Run dsh plugin install zoyluoblue/deepseek-harness-token in your terminal to install; source code at https://github.com/zoyluoblue/deepseek-harness-token.
About this plugin
You have probably hit the same wall while running DeepSeek Harness: how many tokens did I actually burn in total, across every home, every model, every day on this machine? deepseek-harness-token answers that question. It folds the session logs under ~/.dsh and every ~/.dsh_desktop into a single Token page inside Settings — no network calls, no model-facing tool registration, no session-event writes, and zero additional cost to the conversation itself.
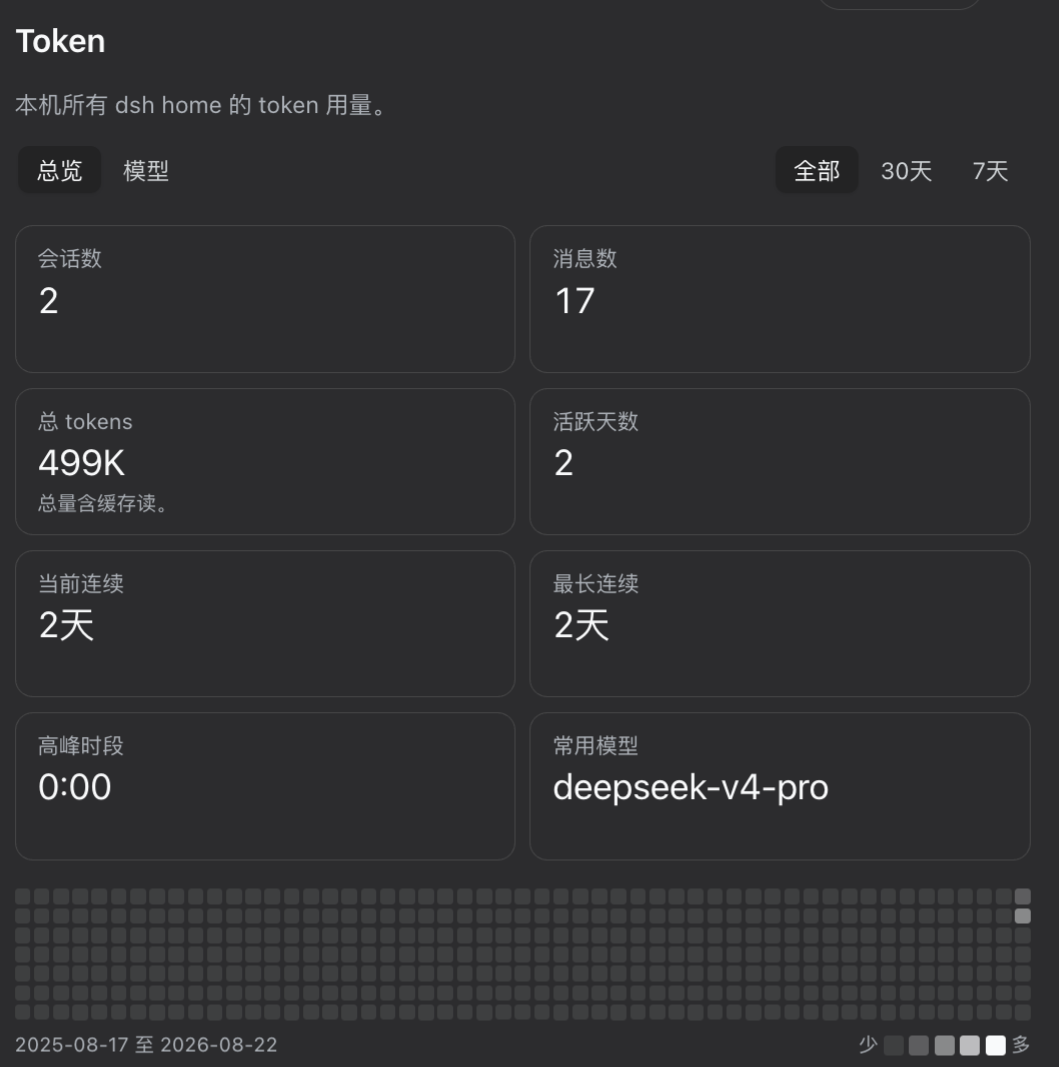
The page leads with headline figures: total tokens, session count, message count, active days, current and longest streak, peak hour, and your most-used model. Below that sits a 53-week, GitHub-style contribution heatmap (a day strip appears when you switch to a 7-day or 30-day window), then a per-model view that splits each model's usage into four disjoint buckets — input, cache read, cache write, and output — so a total dominated by cache reads is visible as such rather than hidden in a grand sum. All day and hour calculations use your local calendar via Intl, meaning a daylight-saving shift will not break a streak. Scanning happens incrementally in the background; the browser side never touches a log byte, only fetching a single loopback JSON response.
It deliberately does not report cost: the harness stores no price table, and any currency figure would be a local guess dressed up as a fact — use dsh-billing for balance and billing questions. It also does not target Electron desktop shells, whose module-resolution pinning can make a profile-installed plugin unresolvable and prevent the app from starting; sessions logged under ~/.dsh_desktop are still fully readable from dsh web, so one entry point is enough. This plugin is for developers who work in Harness daily, want a global token rhythm at a glance, and would rather not open yet another browser tab just to ask a usage question.
Screenshots
Use Cases
- Glance at machine-wide token totals, session count, and a 53-week heatmap inside Settings
- Break per-model usage into input, cache read, cache write, and output buckets to see where tokens actually go
- Track streak days, peak hour, and most-used model to understand your token rhythm over time
Best For
- Developers who work in DeepSeek Harness daily and want a global token view at a glance
- Users who care about cache-read/write split and want four-bucket token transparency
- Anyone who wants a token answer without opening another browser tab or running a script
Related Plugins
A service-oriented sidebar framework for DSH, offering a full workbench with file explorer, embedded browser, real terminal, Git panel, and extensible plugin services.

A beautiful, practical Claude Code-style TUI plugin with pixel whale top bar, flowing glow title, real-time status line, streaming thought expansion, time rewind, context progress bar and TPS gauge — zero core changes.

The plugin market for DeepSeek Harness: browse/search/one-click install community plugins and themes, with updates, backup/restore, hot disable, diagnostics, and AI fix.

A persistent whale widget on the DSH web UI that shows DeepSeek balance, today's usage, and per-turn cost, with drag-and-snap and sound effects.