dsh-top
Run the following command in DeepSeek Harness:
dsh plugin install glenngit/dsh-top
Paste the following prompt into your AI chat to install this plugin:
Run dsh plugin install glenngit/dsh-top in your terminal to complete the installation; the full source repository is https://github.com/glenngit/dsh-top. After installing, restart the web app and refresh the page to see the monitor panel in the top-right corner.
About this plugin
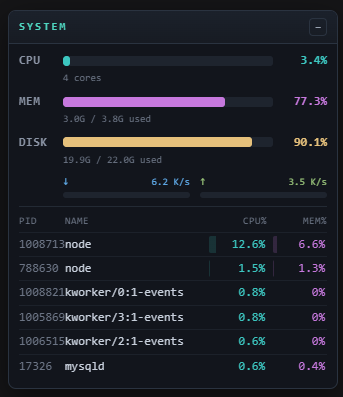
When you are deep in a DeepSeek conversation through the DSH web GUI, checking whether the server is running hot means alt-tabbing to a terminal and firing off top or htop — a small friction that pulls you out of the flow. dsh-top pins a live system monitor to the top-right corner of the browser window: real-time CPU utilisation with core count, memory and disk usage shown as percentage bars, network upload and download throughput, and a Top 6 process table with PID, name, CPU %, and MEM %. The panel is colour-coded in a monospace face, draggable by its title bar, and collapsible with a minus/plus toggle; it polls every two seconds while visible and pauses the moment you fold it away.
CPU and memory meters are guaranteed on every platform because they rely solely on Node's built-in os module with no subprocess involved. Disk, network, and process collectors are adapted per OS — df, /proc/net/dev, and ps on Linux; netstat and BSD ps on macOS; PowerShell applets on Windows — and in containerised environments the code walks the cgroup hierarchy to report the container's actual memory limit and CPU quota rather than the host's totals. On slim or distroless images missing those tools, the affected sections simply render as n/a while the rest of the panel keeps working, and every external command runs with a static argument array and a five-second timeout so a stuck collector degrades gracefully instead of hanging the request.
If you use DeepSeek through the DSH web interface on a local machine, a remote server, or inside Docker and Kubernetes, dsh-top lets you glance at the top-right corner between prompts to confirm how much headroom is left and which process is burning cycles — no window switching, no memorised commands.
Screenshots
Use Cases
- glancing at live CPU and memory load mid-conversation
- verifying cgroup memory and CPU quotas in Docker or K8s
- identifying the top six processes by resource usage without leaving the browser
Best For
- developers interacting with DeepSeek through the DSH web GUI
- ops engineers running DSH inside Docker or Kubernetes
- local users who want resource visibility without alt-tabbing to a terminal
Related Plugins
A service-oriented sidebar framework for DSH, offering a full workbench with file explorer, embedded browser, real terminal, Git panel, and extensible plugin services.

A beautiful, practical Claude Code-style TUI plugin with pixel whale top bar, flowing glow title, real-time status line, streaming thought expansion, time rewind, context progress bar and TPS gauge — zero core changes.

The plugin market for DeepSeek Harness: browse/search/one-click install community plugins and themes, with updates, backup/restore, hot disable, diagnostics, and AI fix.

A persistent whale widget on the DSH web UI that shows DeepSeek balance, today's usage, and per-turn cost, with drag-and-snap and sound effects.