dsh-echarts
Run the following command in DeepSeek Harness:
dsh plugin install sheny-bio/dsh-echarts
Paste the following prompt into your AI chat to install this plugin:
Run dsh plugin install sheny-bio/dsh-echarts in DeepSeek Harness to install this plugin; full source code is available at https://github.com/sheny-bio/dsh-echarts.
About this plugin
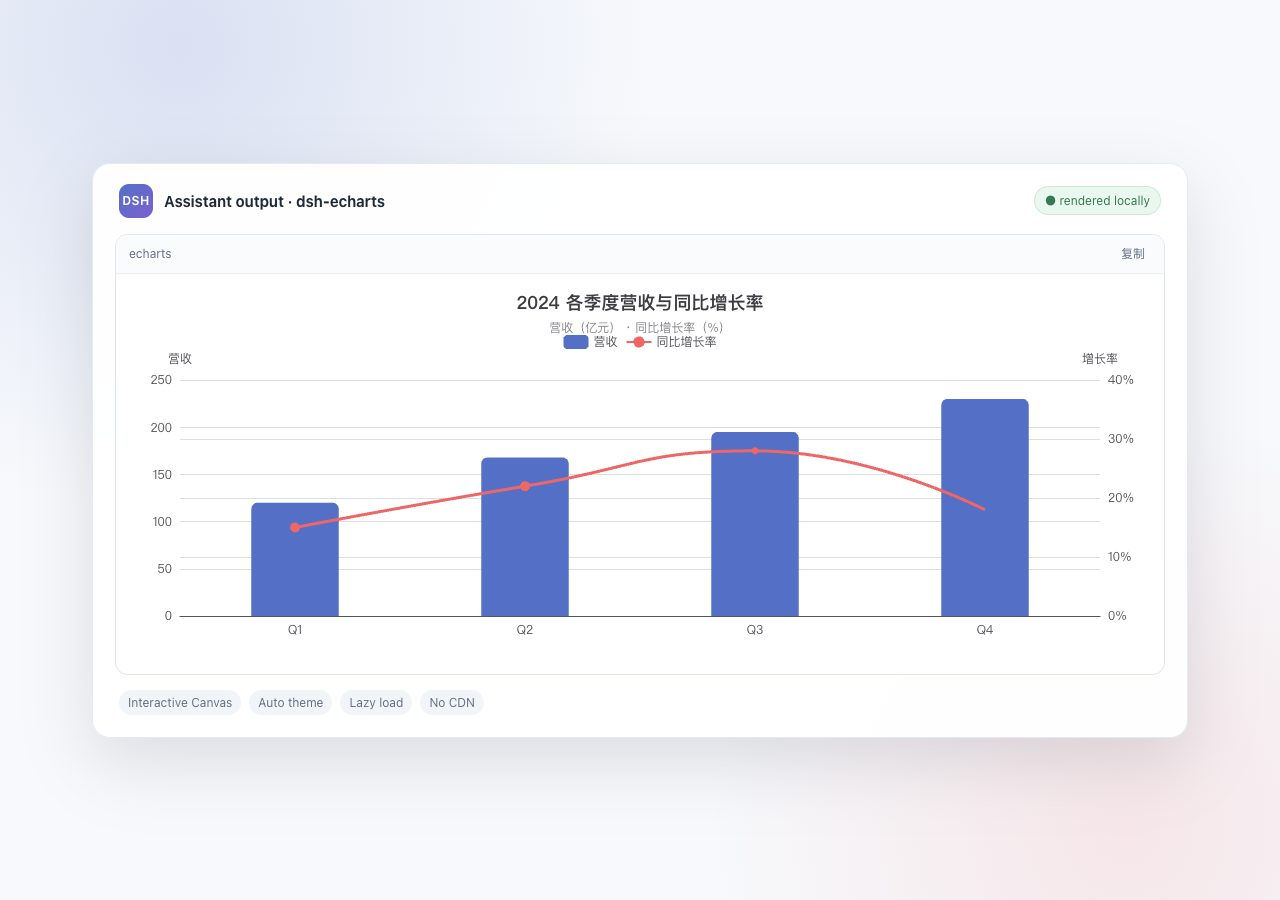
When a model replies with data in a DSH conversation, the chart often stays as a wall of JSON inside a code fence, and you still have to copy it into a browser and run it yourself. dsh-echarts removes that extra step: as soon as the model emits an echarts-fenced Strict JSON block, the plugin automatically renders it into a fully interactive Apache ECharts Canvas chart right in the Web UI, with zero additional tool calls and no manual run action required.
The result is not a static snapshot. Every native ECharts interaction is preserved, including tooltip hover, legend filtering, data-region zooming, and image export, and the chart adapts automatically to the DSH light or dark theme as well as container resize events. On the performance side, ECharts is lazy-loaded: the library initialises only when a chart scrolls close to the viewport, and multiple charts render serially so long conversations stay lightweight. The ECharts bundle ships locally with the plugin with no CDN dependency, JSON input is treated as untrusted and validated, and if rendering fails the original source is kept intact alongside a copyable error message.
It is built for any workflow where you want to see the chart instead of the code: data-analysis conclusions, operations dashboards, experiment comparisons, trend narratives, or simply a dual-axis bar-and-line chart, a donut breakdown, a radar, or a Sankey diagram that should appear as a living visual rather than a JSON blob. As long as the chart option can be expressed in pure JSON, ask the model in one sentence and the chart appears in the next.
Screenshots
Use Cases
- Ask the model to chart quarterly revenue as a dual-axis bar-and-line and see it instantly in DSH
- Render a donut chart of user traffic sources without copying JSON into an external tool
- Visualize experiment comparisons with a radar or Sankey chart directly in the conversation
Best For
- DSH Web users who want charts inline during conversations
- Analysts who frequently ask models to emit data configurations
- Developers who want to skip the copy-paste-run cycle
Related Plugins
A service-oriented sidebar framework for DSH, offering a full workbench with file explorer, embedded browser, real terminal, Git panel, and extensible plugin services.

A beautiful, practical Claude Code-style TUI plugin with pixel whale top bar, flowing glow title, real-time status line, streaming thought expansion, time rewind, context progress bar and TPS gauge — zero core changes.

The plugin market for DeepSeek Harness: browse/search/one-click install community plugins and themes, with updates, backup/restore, hot disable, diagnostics, and AI fix.

A persistent whale widget on the DSH web UI that shows DeepSeek balance, today's usage, and per-turn cost, with drag-and-snap and sound effects.