dsh-deepseek-balance
Run the following command in DeepSeek Harness:
dsh plugin install qianTouchFish/dsh-deepseek-balance
Paste the following prompt into your AI chat to install this plugin:
Run dsh plugin install qianTouchFish/dsh-deepseek-balance in the DeepSeek Harness terminal to install the plugin; source is available at https://github.com/qianTouchFish/dsh-deepseek-balance .
About this plugin
If you run jobs on the DeepSeek API regularly, the least fun part of the day is probably leaving your editor, opening a browser, logging into the platform console, and scrolling through dashboards just to check how much balance you have left or which model is quietly burning tokens. dsh-deepseek-balance pulls all of that into the DSH sidebar so you never have to make that round-trip again.
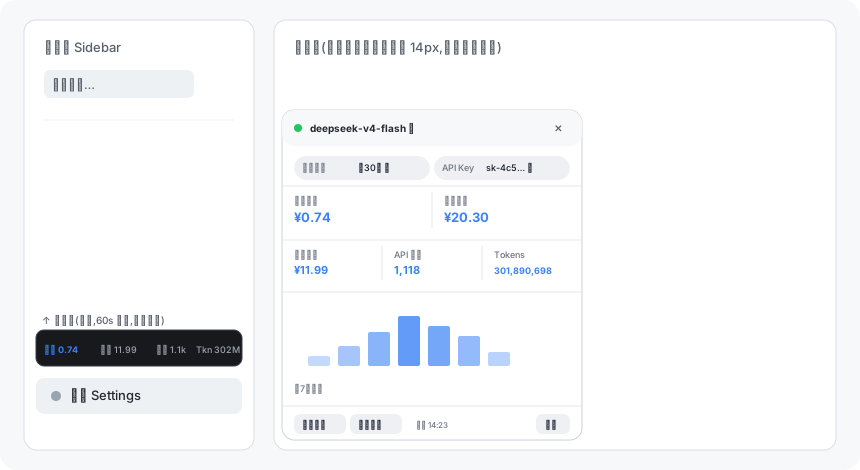
An always-visible usage strip sits above the Settings button, showing balance, cumulative spend, request count, and token usage in real time. It refreshes every minute and turns amber when your balance is running low. Click to expand into a full usage card: per-model and per-period breakdowns (today, yesterday, last 7 days, last 30 days, this month, last month) with mini bar charts, plus the platform's official cumulative spend when a token is configured. A live peak / off-peak badge next to the model selector tells you whether you are inside the pricier billing windows (Beijing time 09:00 12:00 and 14:00 18:00). The card also includes a one-click token extractor that reads the platform token straight from your local Chrome, Edge, or Chromium profile, eliminating the manual F12 copy step.
This plugin is for developers who call the DeepSeek API often from within DSH, juggle multiple models or batch jobs, and care about cost visibility. Once installed, your spending numbers stay within arm's reach so you can top up, switch models, or throttle requests without ever leaving the editor.
Screenshots
Use Cases
- Running high-frequency DeepSeek API calls inside DSH and needing instant visibility into balance and token consumption
- Juggling multiple models in parallel and wanting to see which one is burning budget and whether you are in a peak billing window
- Checking usage without leaving the editor to navigate the platform console in a browser
Best For
- Developers who use the DeepSeek API daily within DSH
- AI engineers managing costs across multiple models and batch jobs
- Solo developers who want usage data always visible inside their IDE
Related Plugins
A service-oriented sidebar framework for DSH, offering a full workbench with file explorer, embedded browser, real terminal, Git panel, and extensible plugin services.

A beautiful, practical Claude Code-style TUI plugin with pixel whale top bar, flowing glow title, real-time status line, streaming thought expansion, time rewind, context progress bar and TPS gauge — zero core changes.

The plugin market for DeepSeek Harness: browse/search/one-click install community plugins and themes, with updates, backup/restore, hot disable, diagnostics, and AI fix.

A persistent whale widget on the DSH web UI that shows DeepSeek balance, today's usage, and per-turn cost, with drag-and-snap and sound effects.