dsh-sysmon
Run the following command in DeepSeek Harness:
dsh plugin install 21hbguo/dsh-sysmon
Paste the following prompt into your AI chat to install this plugin:
Run dsh plugin install 21hbguo/dsh-sysmon to install this plugin inside DeepSeek Harness; the project repository is https://github.com/21hbguo/dsh-sysmon
About this plugin
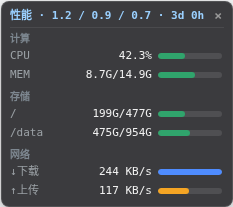
You are deep in a DSH session, prompts flowing, models spinning. You want a casual glance at whether host CPU, memory, or network is spiking, but you do not want to alt-tab to a terminal and run htop, and you certainly do not want to wire up a React monitoring widget on top of the Web GUI. dsh-sysmon fills exactly that gap: a small floating panel in the bottom-right corner that appears the moment you refresh the page, built with zero front-end frameworks on the client side and zero third-party dependencies on the host (just /proc reads and node:os). It polls the same-origin snapshot endpoint every two seconds, pauses automatically when the tab is hidden, and caches snapshots on the host so repeated polls do not re-read /proc. The total footprint is negligible.
The panel covers the metrics that matter day to day: CPU, memory, and disk (multiple physical mount points, root first) each with a progress bar; network download and upload shown on separate rows with auto-scaled bars based on recent peaks. Hovering either network row reveals a per-process TOP 10 overlay, sorted by byte rate when ss provides counters, or gracefully falling back to active connection count when it does not. For GPU, AMD is read directly from sysfs with zero child processes, while NVIDIA samples via nvidia-smi in a non-blocking background loop. The widget is draggable, collapsible to a single line, and hideable with a summon button; position persists in localStorage across refreshes.
It is aimed at developers and operators who are already living inside a DeepSeek Harness process. Linux gives you the full feature set (total network rate, process TOP 10, process count all lean on /proc or ss); non-Linux platforms still get CPU, memory, disk, load, uptime, and GPU, with network and process rows silently degrading to empty rather than breaking anything.
Screenshots
Use Cases
- Watch CPU, memory, disk, and network load inside the DSH Web GUI
- Inspect per-process download/upload TOP 10 while diagnosing network spikes
- Check AMD or NVIDIA GPU usage at minimal cost while running DSH locally
- Collapse or drag the widget during long sessions to avoid covering the workspace
Best For
- Developers who work inside DeepSeek Harness daily
- Operators who want lightweight host-load visibility
- Local DSH users who prefer to avoid extra monitoring frameworks
Related Plugins
A service-oriented sidebar framework for DSH, offering a full workbench with file explorer, embedded browser, real terminal, Git panel, and extensible plugin services.

A beautiful, practical Claude Code-style TUI plugin with pixel whale top bar, flowing glow title, real-time status line, streaming thought expansion, time rewind, context progress bar and TPS gauge — zero core changes.

The plugin market for DeepSeek Harness: browse/search/one-click install community plugins and themes, with updates, backup/restore, hot disable, diagnostics, and AI fix.

A persistent whale widget on the DSH web UI that shows DeepSeek balance, today's usage, and per-turn cost, with drag-and-snap and sound effects.