dsh-token-dashboard
Run the following command in DeepSeek Harness:
dsh plugin install tsja2001/dsh-token-dashboard
Paste the following prompt into your AI chat to install this plugin:
Install this plugin in DeepSeek Harness by running dsh plugin install tsja2001/dsh-token-dashboard; the source code is hosted at https://github.com/tsja2001/dsh-token-dashboard
About this plugin
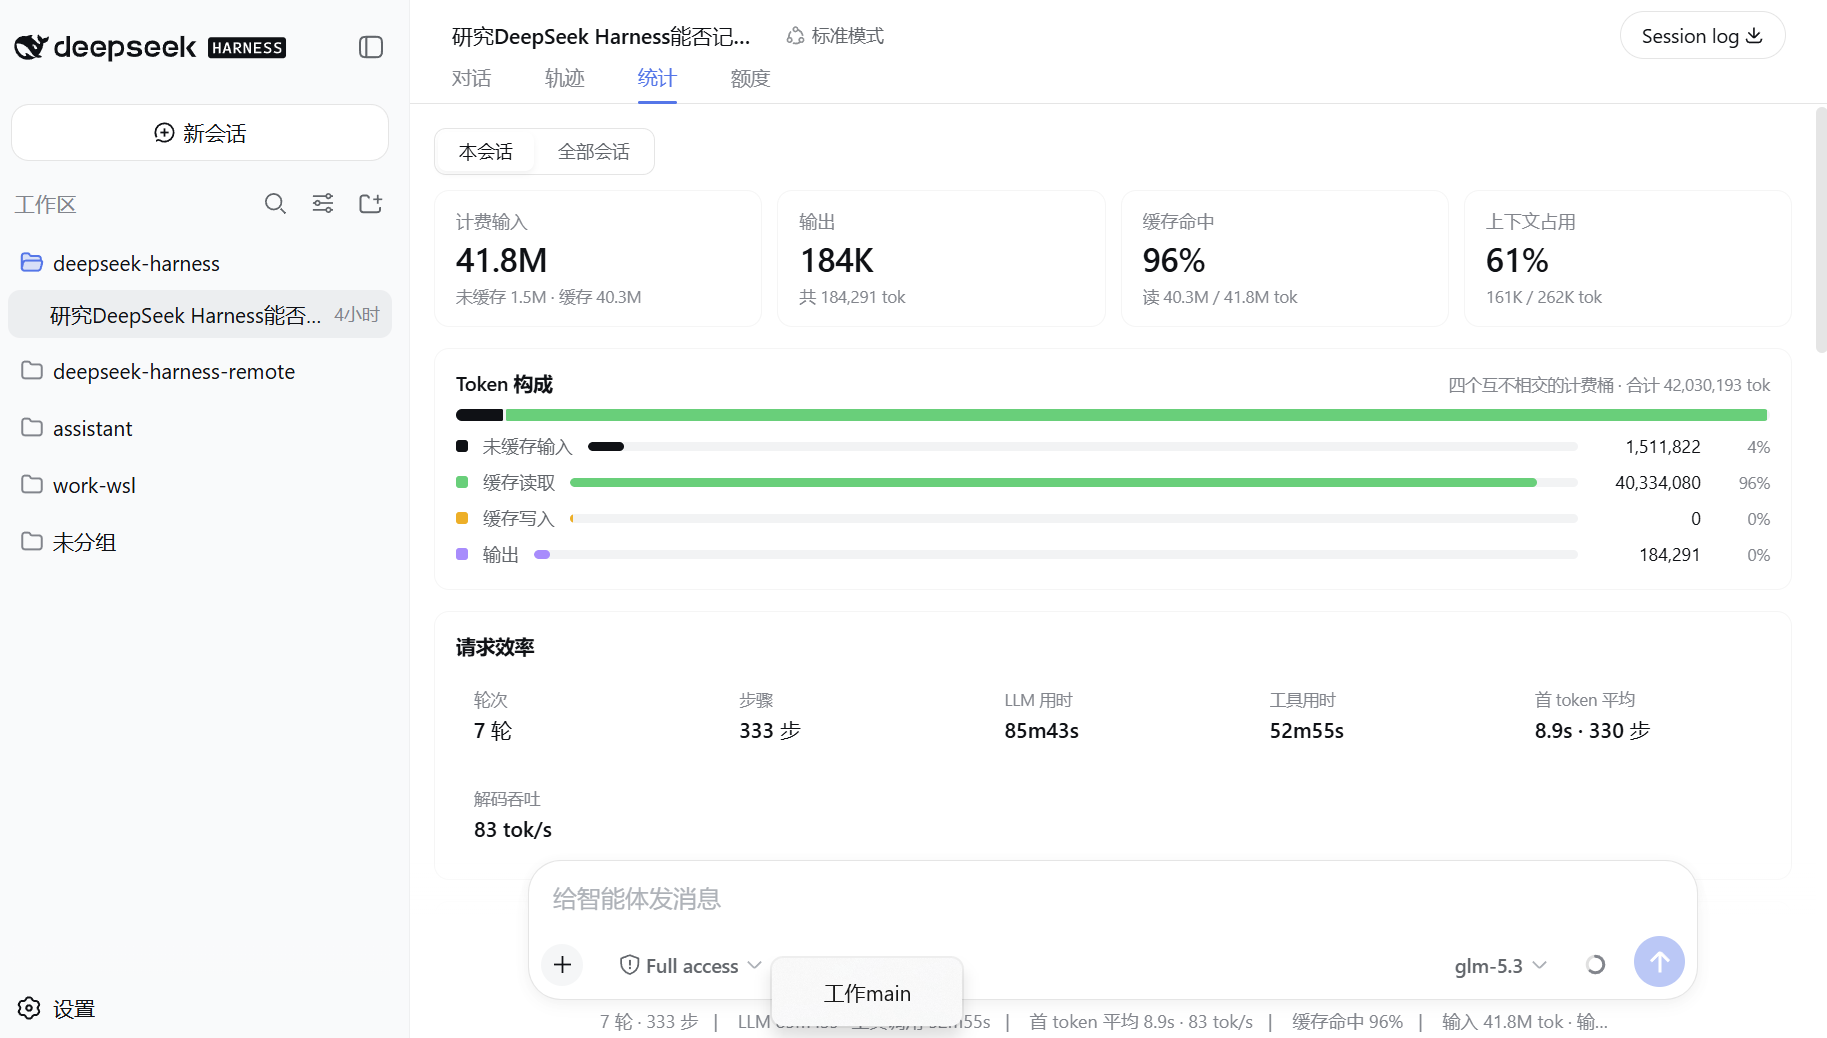
When working with DeepSeek Harness, token consumption is often a blur: how much of your billed input is cache hits, which step inflates TTFT, and how sessions compare side by side. dsh-token-dashboard brings all of these metrics into a single Statistics tab in DSH Web, making every token account transparent at a glance.
The plugin layers five views: a per-session token overview (billed input, output, cache hit rate, context usage), a token composition breakdown (uncached input, cache reads, cache writes, and output shares), a request-efficiency panel (rounds, steps, LLM and tool latency, average TTFT, decode throughput), a step-by-step drill-down (model, status, reasoning tokens, TTFT, tok/s), and a cross-session comparison with sorting that distinguishes current, running, and sub-agent sessions. All data is read directly from DSH pre-computed projections; the plugin has no server, database, telemetry, or network calls of any kind, making it a purely local, read-only display.
If you call DeepSeek Harness frequently in your daily workflow, want to pinpoint context-pressure sources, verify cache-utilization health, or compare usage across multiple sessions, this plugin is ready to use out of the box with zero configuration and zero extra token overhead.
Screenshots
Use Cases
- Pinpoint where tokens are spent and how much hits the cache in a session
- Diagnose inflated TTFT or low decode throughput in a specific step
- Sort and compare token usage across sessions, including sub-agent overhead
Best For
- Developers calling DeepSeek Harness who want full token-account visibility
- AI engineers tracking cache efficiency and context pressure with quantified metrics
- Teams comparing usage across sessions and debugging performance bottlenecks
Related Plugins
A service-oriented sidebar framework for DSH, offering a full workbench with file explorer, embedded browser, real terminal, Git panel, and extensible plugin services.

A beautiful, practical Claude Code-style TUI plugin with pixel whale top bar, flowing glow title, real-time status line, streaming thought expansion, time rewind, context progress bar and TPS gauge — zero core changes.

The plugin market for DeepSeek Harness: browse/search/one-click install community plugins and themes, with updates, backup/restore, hot disable, diagnostics, and AI fix.

A persistent whale widget on the DSH web UI that shows DeepSeek balance, today's usage, and per-turn cost, with drag-and-snap and sound effects.