dsh-client-ui-trace-graph
Run the following command in DeepSeek Harness:
dsh plugin install tieveto666-code/dsh-client-ui-trace-graph
Paste the following prompt into your AI chat to install this plugin:
Run dsh plugin install tieveto666-code/dsh-client-ui-trace-graph in the DeepSeek Harness terminal; the source repository is available at https://github.com/tieveto666-code/dsh-client-ui-trace-graph.
About this plugin
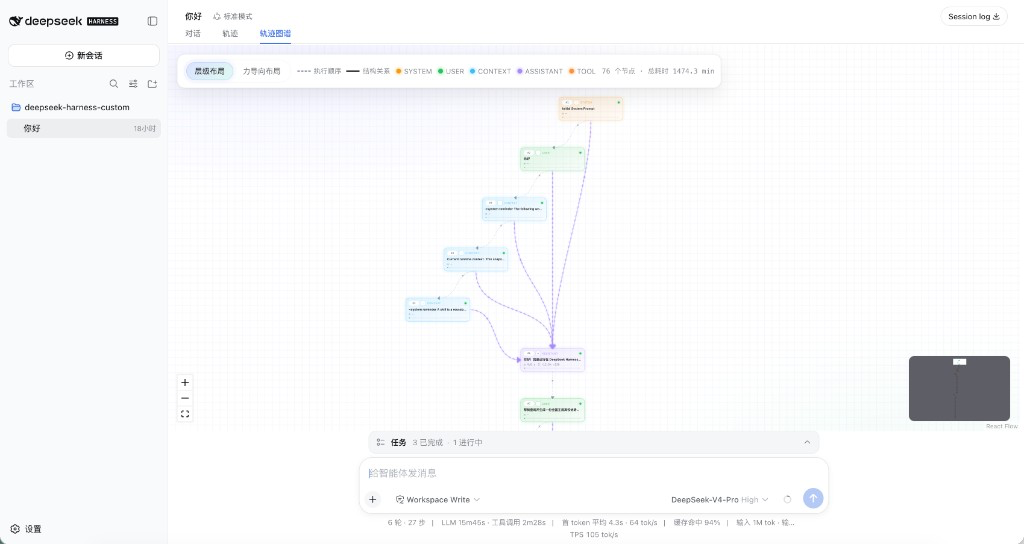
The official DSH "Trajectory" tab is a powerful inspection table, but a flat list makes it hard to see execution order, causal nesting, and the full shape of an agent loop at a glance. This plugin reads that exact same trajectory ledger and renders it as an interactive ReactFlow DAG, adding a spatial dimension to how you read a run.
Two edge types carry the meaning: gray dashed sequence edges always encode chronological order (A happened, then B), while colored solid structure edges appear only when row fields prove a causal or nesting link, with no invented arrows. Nodes are typed by role (SYSTEM, USER, CONTEXT, ASSISTANT, TOOL, SUBTOOL, COMPACTION) and display summary, sequence number, latency, status, and token usage; click any node to inspect its recorded Input/Output JSON. The toolbar lets you toggle between a dagre hierarchical layout for causal depth and a d3-force organic overview, and hovering highlights upstream and downstream neighbors.
It mounts as a first-party conversation tab alongside the official views, no modal and no center-column takeover, with chrome colors that follow --dsw-* themes out of the box. If you routinely debug agent loops, trace tool-call chains, or need to explain a session execution structure to teammates, the Trace Graph tab turns what was a table into a picture you can read in a second.
Screenshots
Use Cases
- Debugging agent loops by tracing tool-call nesting and causality
- Presenting a session execution order and causal structure to teammates
- Diagnosing tool-call failures by walking back through upstream and downstream links
Best For
- Developers who need visual debugging of agent execution chains
- Engineers building multi-turn conversation products with DSH
- Teams that explain session execution structure to non-technical stakeholders
Related Plugins
A service-oriented sidebar framework for DSH, offering a full workbench with file explorer, embedded browser, real terminal, Git panel, and extensible plugin services.

A beautiful, practical Claude Code-style TUI plugin with pixel whale top bar, flowing glow title, real-time status line, streaming thought expansion, time rewind, context progress bar and TPS gauge — zero core changes.

The plugin market for DeepSeek Harness: browse/search/one-click install community plugins and themes, with updates, backup/restore, hot disable, diagnostics, and AI fix.

A persistent whale widget on the DSH web UI that shows DeepSeek balance, today's usage, and per-turn cost, with drag-and-snap and sound effects.