dsh_token_usage
Run the following command in DeepSeek Harness:
dsh plugin install xbyzzZ/dsh_token_usage
Paste the following prompt into your AI chat to install this plugin:
Run dsh plugin install xbyzzZ/dsh_token_usage in your terminal to install; the repository is at https://github.com/xbyzzZ/dsh_token_usage
About this plugin
After a few days of living in DeepSeek Harness, you probably start wondering where the token spend actually went, which model is burning the most, and whether cache hits are even being counted. The problem is that DSH ships no built-in usage view -- session logs sit in compressed local files, and pulling numbers out means writing your own scripts.
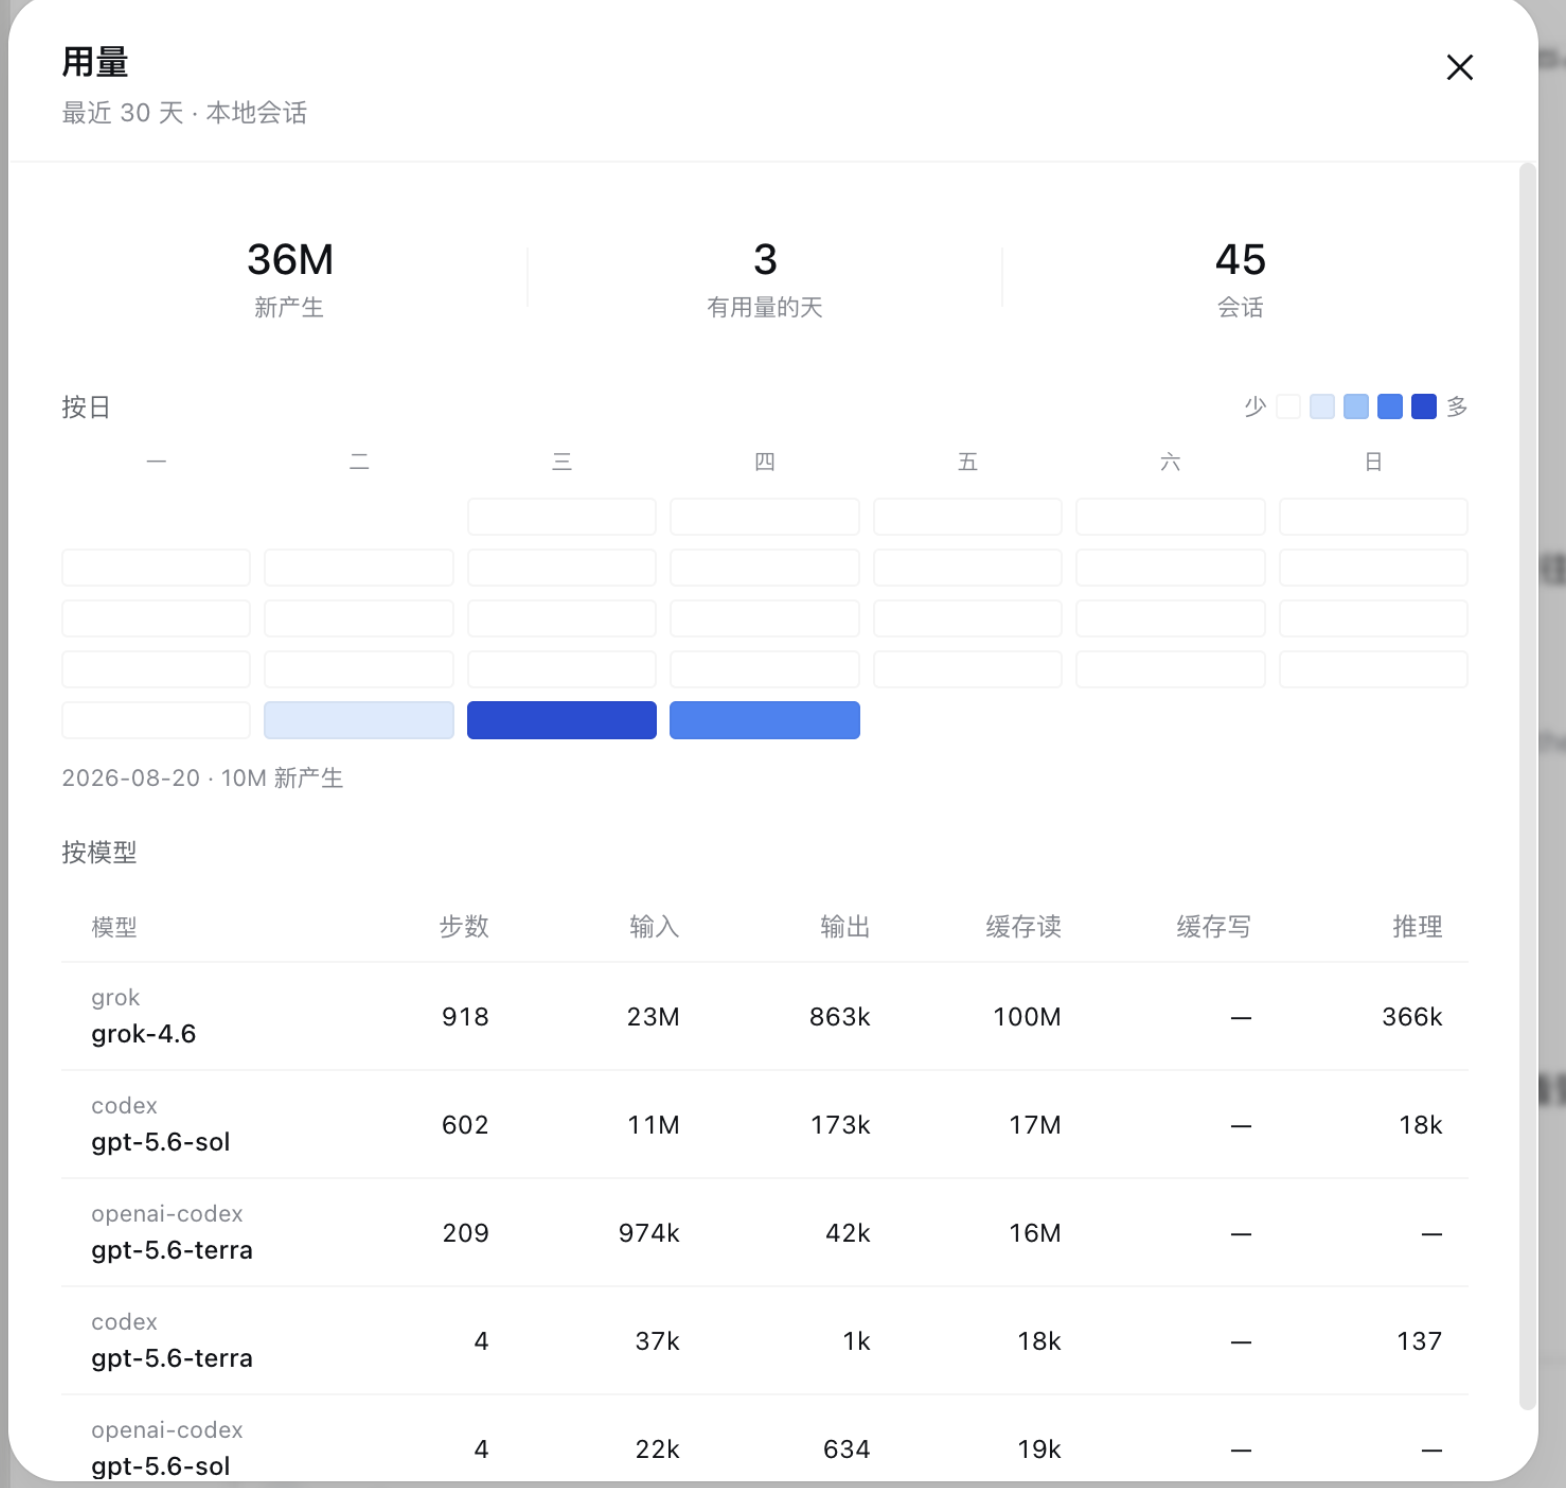
dsh_token_usage keeps things simple. It reads the session logs under the sessions directory, aggregates the token usage that providers report over the last 30 days, and drops a Usage entry just above the Settings button in the sidebar. Click it and you get a heatmap plus a per-model breakdown. The heatmap makes it obvious which days were heavy and which were quiet -- white-to-blue in light mode, black-to-blue in dark. The model table lays out input, output, cache reads, cache writes, and reasoning tokens in separate columns; the headline number is new tokens (input + output + cache writes), while cache reads and reasoning are listed on their own rather than folded in. Older sessions that carry no usage field are skipped entirely; the plugin never estimates from character counts.
The whole thing is a standalone bundle: no DSH source modifications, no sidebar replacement, no database. Install it, restart, and the entry appears. It is aimed at everyday DSH users who want a low-effort way to track token spend, compare usage across models, and keep an eye on cache hit rates versus reasoning overhead.
Screenshots
Use Cases
- See at a glance which models consumed the most tokens in the last 30 days
- Compare input-to-output ratios across providers and models
- Check how cache reads and reasoning tokens break down per model
Best For
- Developers using DeepSeek Harness daily who want visibility into token spend
- Users running multiple models concurrently and needing per-model cost comparison
- Analytical users who track cache hit rates and reasoning overhead
Related Plugins
A service-oriented sidebar framework for DSH, offering a full workbench with file explorer, embedded browser, real terminal, Git panel, and extensible plugin services.

A beautiful, practical Claude Code-style TUI plugin with pixel whale top bar, flowing glow title, real-time status line, streaming thought expansion, time rewind, context progress bar and TPS gauge — zero core changes.

The plugin market for DeepSeek Harness: browse/search/one-click install community plugins and themes, with updates, backup/restore, hot disable, diagnostics, and AI fix.

A persistent whale widget on the DSH web UI that shows DeepSeek balance, today's usage, and per-turn cost, with drag-and-snap and sound effects.