dsh-sseye
Run the following command in DeepSeek Harness:
dsh plugin install jhuanxx44/dsh-sseye
Paste the following prompt into your AI chat to install this plugin:
Run dsh plugin install jhuanxx44/dsh-sseye in your DeepSeek Harness terminal to install; the source repository is hosted at https://github.com/jhuanxx44/dsh-sseye .
About this plugin
When running agents inside DeepSeek Harness, the most useful debugging question is often the simplest: what exactly did the model receive and return on this turn? The full system prompt, every message in the array, the tool schemas, each streaming chunk, the real wire protocol, the endpoint — none of it is visible in the normal UI. Reaching for mitmproxy works, but adding a CA, trusting a root certificate, and still losing agent-turn semantics makes the loop slow and error-prone.
dsh-sseye taps the harness-internal llm/stream waterfall directly, so every GenerateOptions object (system prompt, messages, tools, sampling params) and every response stream chunk pass through unchanged. Chunk identity, ordering, backpressure, and thrown errors are all preserved. Each capture is tagged with turn, step, session, and compaction attribution, classified by source (agent loop, compaction, session title, or other), and enriched with TTFT, total duration, token usage including cache-read, and finish reason. The real wire protocol and endpoint are resolved from the provider profile, with a clearly-marked fallback for routes that do not declare one.
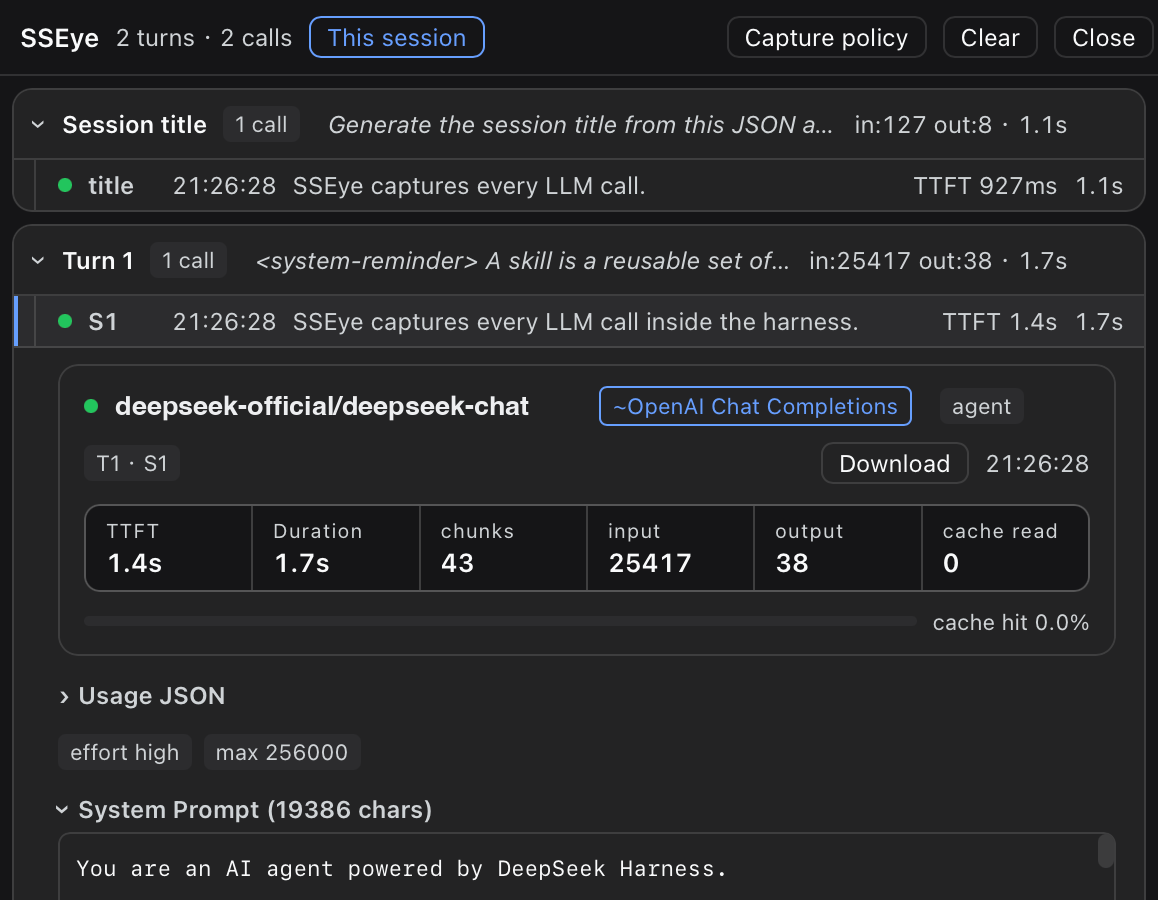
The viewer is a DevTools-style panel docked in the right details column. Calls are grouped by turn with a collapsible header showing call count, in/out tokens, and total duration. Each row expands in place via an inline accordion, revealing the full detail: provider, model, protocol chip, endpoint, a stats grid with a cache-hit ratio bar, system prompt, messages, tool names, and response blocks. A first-degree context diff collapses the shared message prefix and highlights only the newly added content. Wire JSON reconstruction mirrors the DeepSeek adapter serialization, tool results expand to standalone role:tool messages, and reasoning replays as reasoning_content. Live streaming mode polls settling fields while a call is in flight, and JSON export is available per call or per turn bundle.
Built for developers who debug agent loops, compare multi-provider routing, trace compaction or tool-call regressions inside Harness. No proxy, no certificates, no extra service — install the plugin, restart, and the SSEye button appears in the session header, ready to open every model call like a browser DevTools panel.
Screenshots
Use Cases
- Trace a specific prompt or tool-call anomaly in a multi-turn agent loop
- Compare wire protocols, endpoints, and response chunking across providers
- Debug how compaction or session-title background calls affect context
Best For
- Developers building agent applications inside DeepSeek Harness
- LLM engineers comparing multi-provider routing and wire formats
- Debuggers tracing tool-call regressions or context drift in agent loops
Related Plugins
A service-oriented sidebar framework for DSH, offering a full workbench with file explorer, embedded browser, real terminal, Git panel, and extensible plugin services.

A beautiful, practical Claude Code-style TUI plugin with pixel whale top bar, flowing glow title, real-time status line, streaming thought expansion, time rewind, context progress bar and TPS gauge — zero core changes.

The plugin market for DeepSeek Harness: browse/search/one-click install community plugins and themes, with updates, backup/restore, hot disable, diagnostics, and AI fix.

A persistent whale widget on the DSH web UI that shows DeepSeek balance, today's usage, and per-turn cost, with drag-and-snap and sound effects.