dsh-plugin-token-usage
Run the following command in DeepSeek Harness:
dsh plugin install Hjay1101/dsh-plugin-token-usage
Paste the following prompt into your AI chat to install this plugin:
Run dsh plugin install Hjay1101/dsh-plugin-token-usage inside DeepSeek Harness to install the plugin; the source is at https://github.com/Hjay1101/dsh-plugin-token-usage .
About this plugin
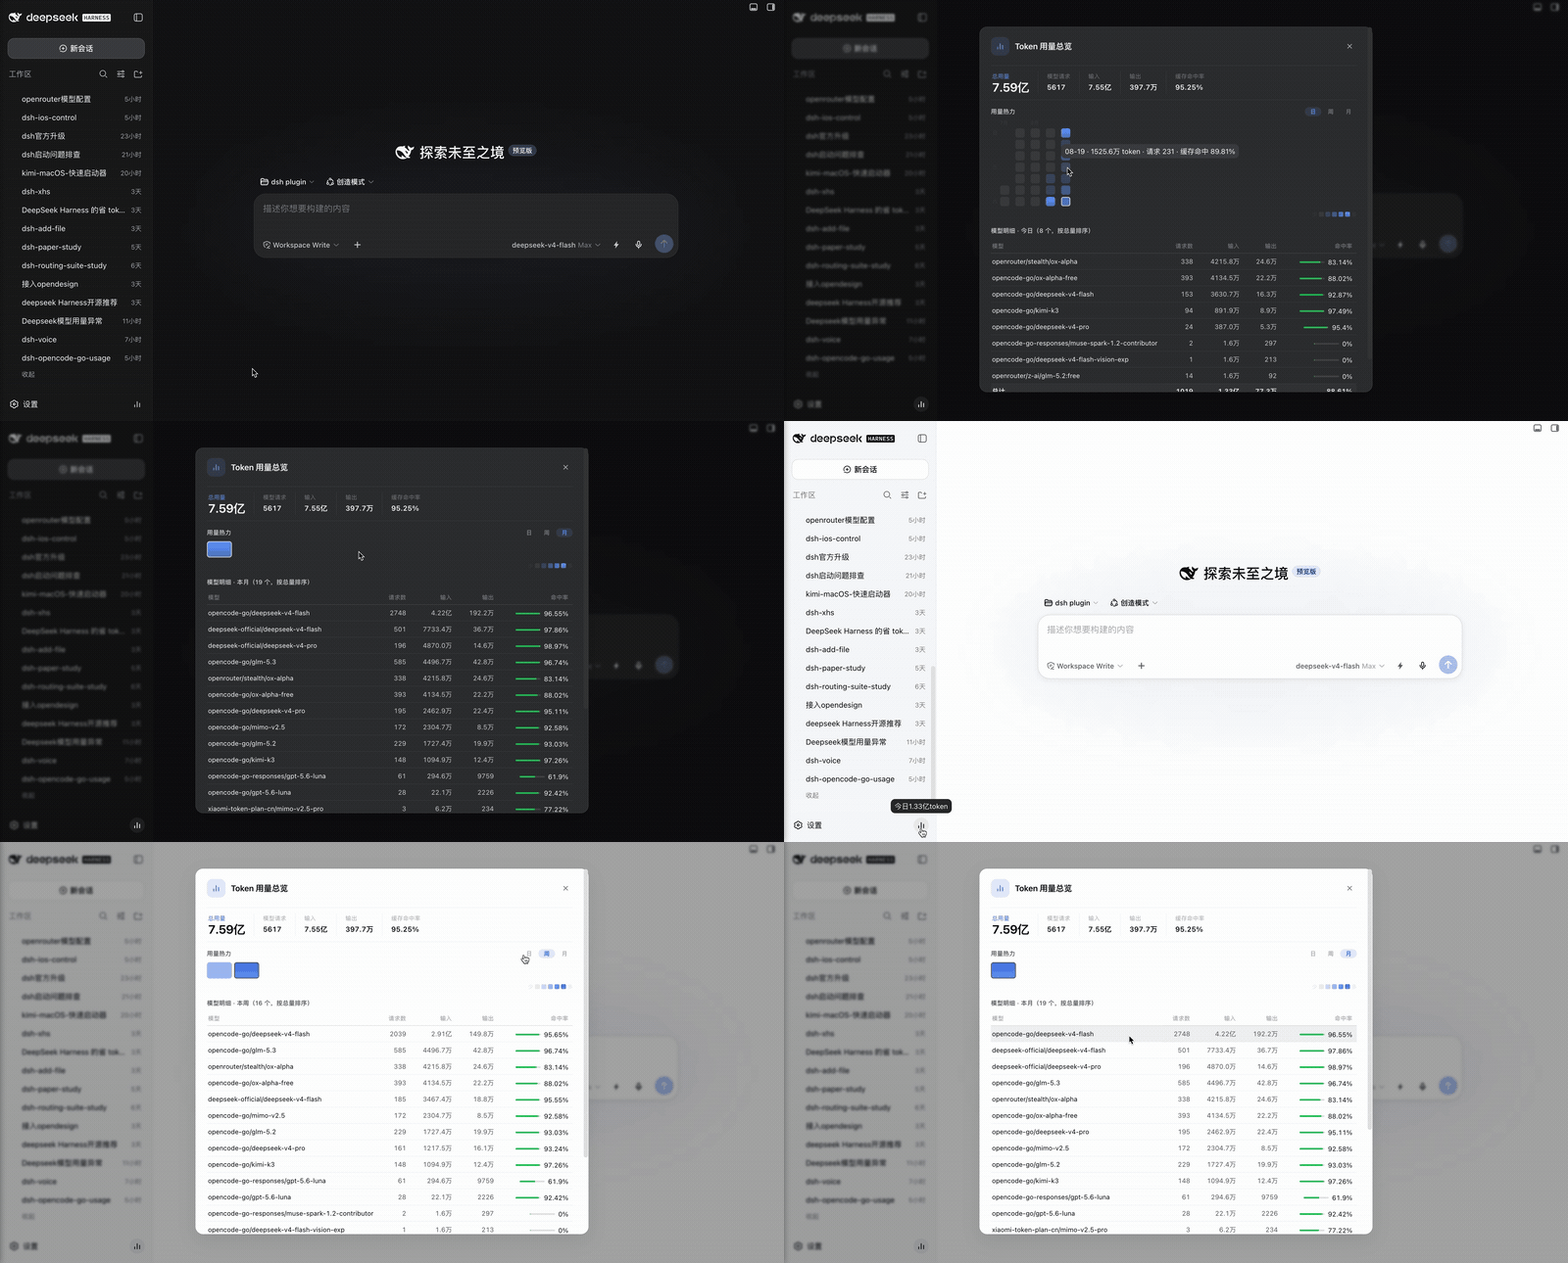
You have been running DeepSeek Harness for a while. Every session you start writes token counts, request numbers, and cache-hit ratios straight into the local session logs under ~/.dsh/sessions/. The data is right there, yet there has never been a visual entry point to answer where your tokens actually went and which model burns the most. dsh-plugin-token-usage turns that quiet log stream into a GitHub-style 30-day usage heat map with a five-level colour scale, Sunday-first columns, month labels, and instant hover tooltips showing daily tokens, request count, and cache-hit percentage. Toggle between day, week, and month views with one click; the colour scale renormalises to match whichever granularity you pick.
Beneath the map sits a granularity-linked per-model table that aggregates exact in-window figures through dual session-by-day and model-by-day indexes — no approximations, no sampling. Models that logged requests but produced zero actual tokens are filtered out automatically so your totals stay honest. A sidebar hover badge refreshes the daily token count on a silent 30-second poll and rolls over at midnight without prompting. Or skip the panel entirely: ask your agent to call the usage_report tool and get the same numbers mid-conversation.
Everything is read-only parsing of local logs with streamed zstd decompression at eight-way concurrency. No network requests, no disk writes, no telemetry — your usage data never leaves the machine. It is a good fit for solo developers doing periodic cost self-audits, team leads who want a one-glance usage trend before a stand-up, and any Harness user who wants to turn how much spent into exactly where it went.
Screenshots
Use Cases
- Scan the last 30 days of daily token usage and spot peak days
- Compare exact in-window consumption across models to find top cost drivers
- Ask the agent for today's token total mid-conversation without opening the panel
Best For
- Individual developers tracking personal token spend
- Tech leads who need a quick usage trend glance before stand-up
- Privacy-conscious users who want all analytics to stay on-device
Related Plugins
A service-oriented sidebar framework for DSH, offering a full workbench with file explorer, embedded browser, real terminal, Git panel, and extensible plugin services.

A beautiful, practical Claude Code-style TUI plugin with pixel whale top bar, flowing glow title, real-time status line, streaming thought expansion, time rewind, context progress bar and TPS gauge — zero core changes.

The plugin market for DeepSeek Harness: browse/search/one-click install community plugins and themes, with updates, backup/restore, hot disable, diagnostics, and AI fix.

A persistent whale widget on the DSH web UI that shows DeepSeek balance, today's usage, and per-turn cost, with drag-and-snap and sound effects.