dsh-token-heatmap
Run the following command in DeepSeek Harness:
dsh plugin install Hou-DL/dsh-token-heatmap
Paste the following prompt into your AI chat to install this plugin:
Install the plugin by running dsh plugin install Hou-DL/dsh-token-heatmap in your DeepSeek Harness terminal; the source code is available at https://github.com/Hou-DL/dsh-token-heatmap .
About this plugin
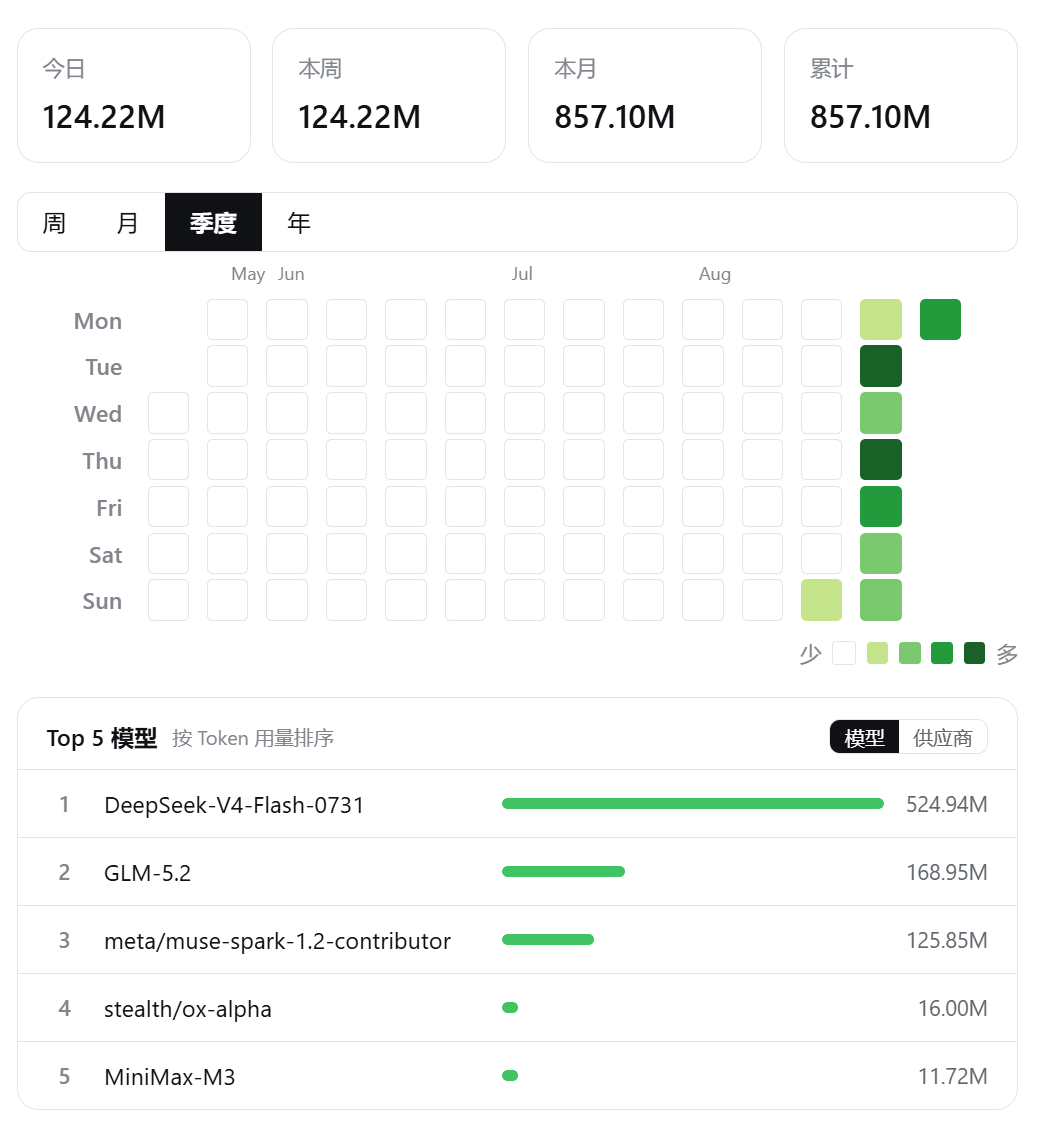
At the end of each billing cycle, do you ever wonder which days or models actually consumed the most tokens? dsh-token-heatmap renders your local session logs into a GitHub-style usage heatmap embedded directly in the DSH Web settings page—entirely offline, with zero calls to any billing or balance API.
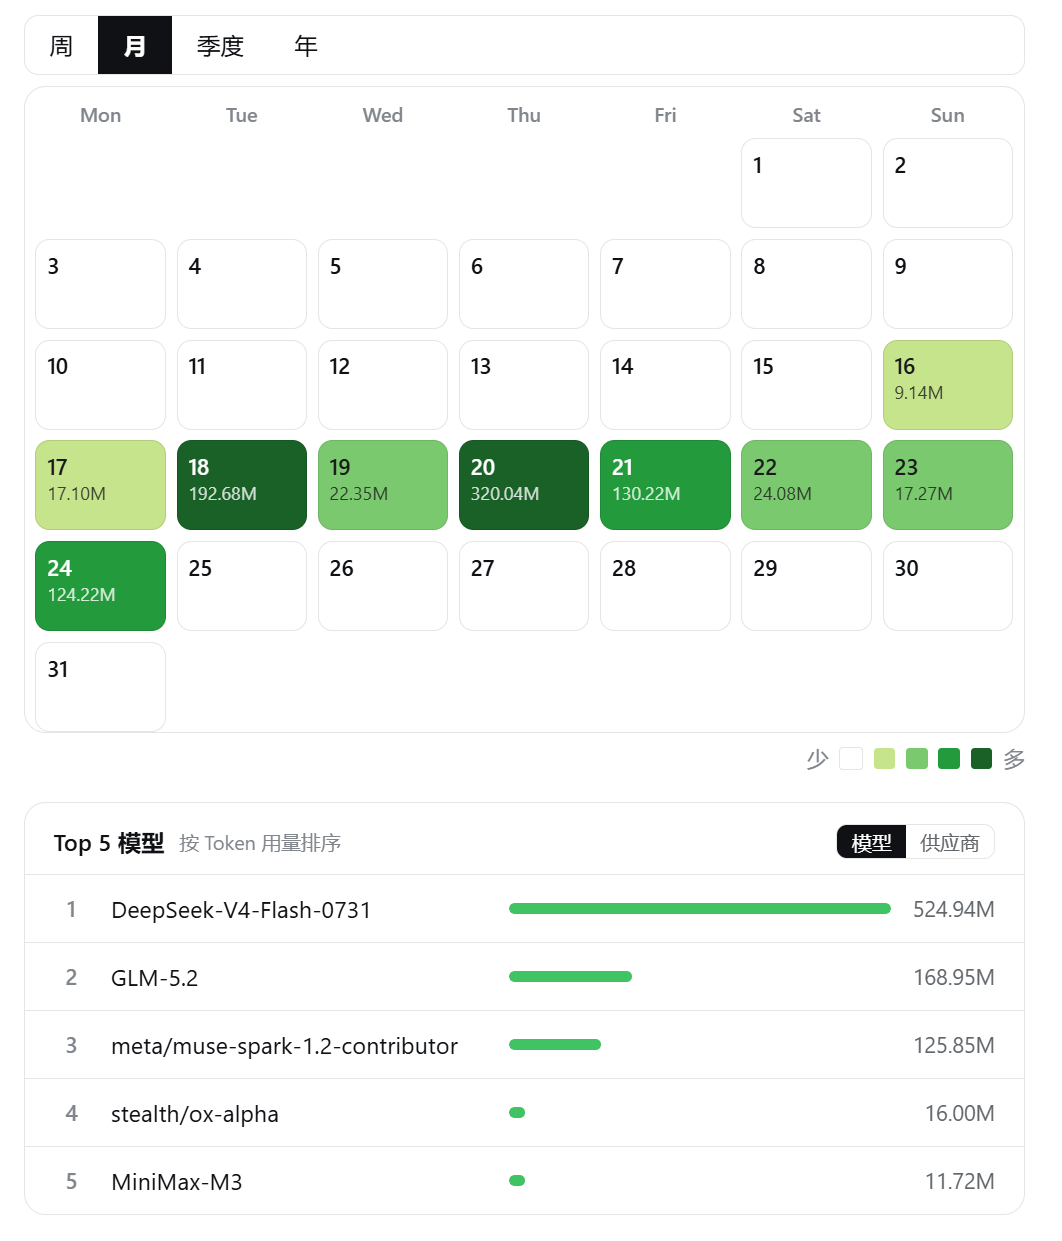
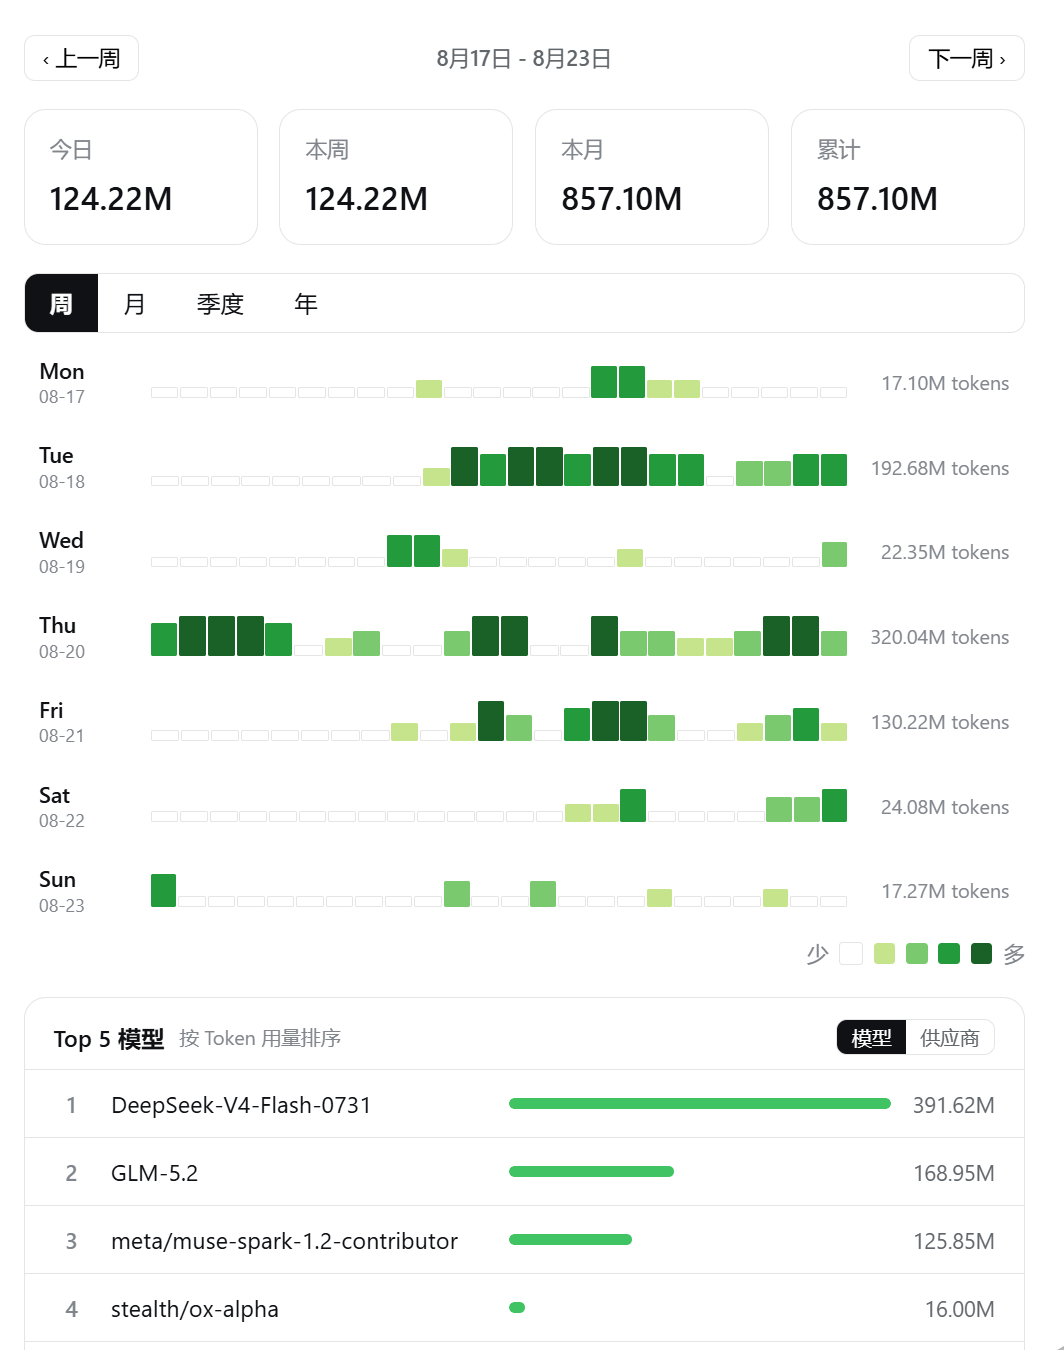
The plugin offers four switchable views: weekly (hourly bar columns), monthly (calendar grid), quarterly (90-day lattice), and yearly (full-year two-row layout). Colors scale across four intensity tiers within each window, while a summary bar tracks today, this week, this month, and cumulative totals. Top 5 rankings switch dynamically between model and vendor, auto-refresh can be set anywhere from 5 to 60 minutes or disabled entirely, and the interface toggles between Chinese and English. All history is persisted to disk, so deleting a session never erases your statistics.
Built for developers and AI engineers who run multi-model inference through DSH Web and want a private, local-first, zero-network way to inspect their token consumption patterns, peak hours, and model-level spending.
Screenshots
Use Cases
- Review local token consumption at month-end to spot peak days and high-cost models
- Compare usage share across models and vendors to guide inference selection
- Track weekly peak hours to better schedule batch jobs
Best For
- Developers running multi-model inference via DSH Web
- AI engineers requiring local offline token usage auditing
- Tech leads focused on cost optimization and usage trends
Related Plugins
A service-oriented sidebar framework for DSH, offering a full workbench with file explorer, embedded browser, real terminal, Git panel, and extensible plugin services.

A beautiful, practical Claude Code-style TUI plugin with pixel whale top bar, flowing glow title, real-time status line, streaming thought expansion, time rewind, context progress bar and TPS gauge — zero core changes.

The plugin market for DeepSeek Harness: browse/search/one-click install community plugins and themes, with updates, backup/restore, hot disable, diagnostics, and AI fix.

A persistent whale widget on the DSH web UI that shows DeepSeek balance, today's usage, and per-turn cost, with drag-and-snap and sound effects.