dsh-token-dashboard
Run the following command in DeepSeek Harness:
dsh plugin install apodemakeles/dsh-token-dashboard
Paste the following prompt into your AI chat to install this plugin:
Install from https://github.com/apodemakeles/dsh-token-dashboard by running dsh plugin install apodemakeles/dsh-token-dashboard, then restart dsh web to see the Token entry in the sidebar.
About this plugin
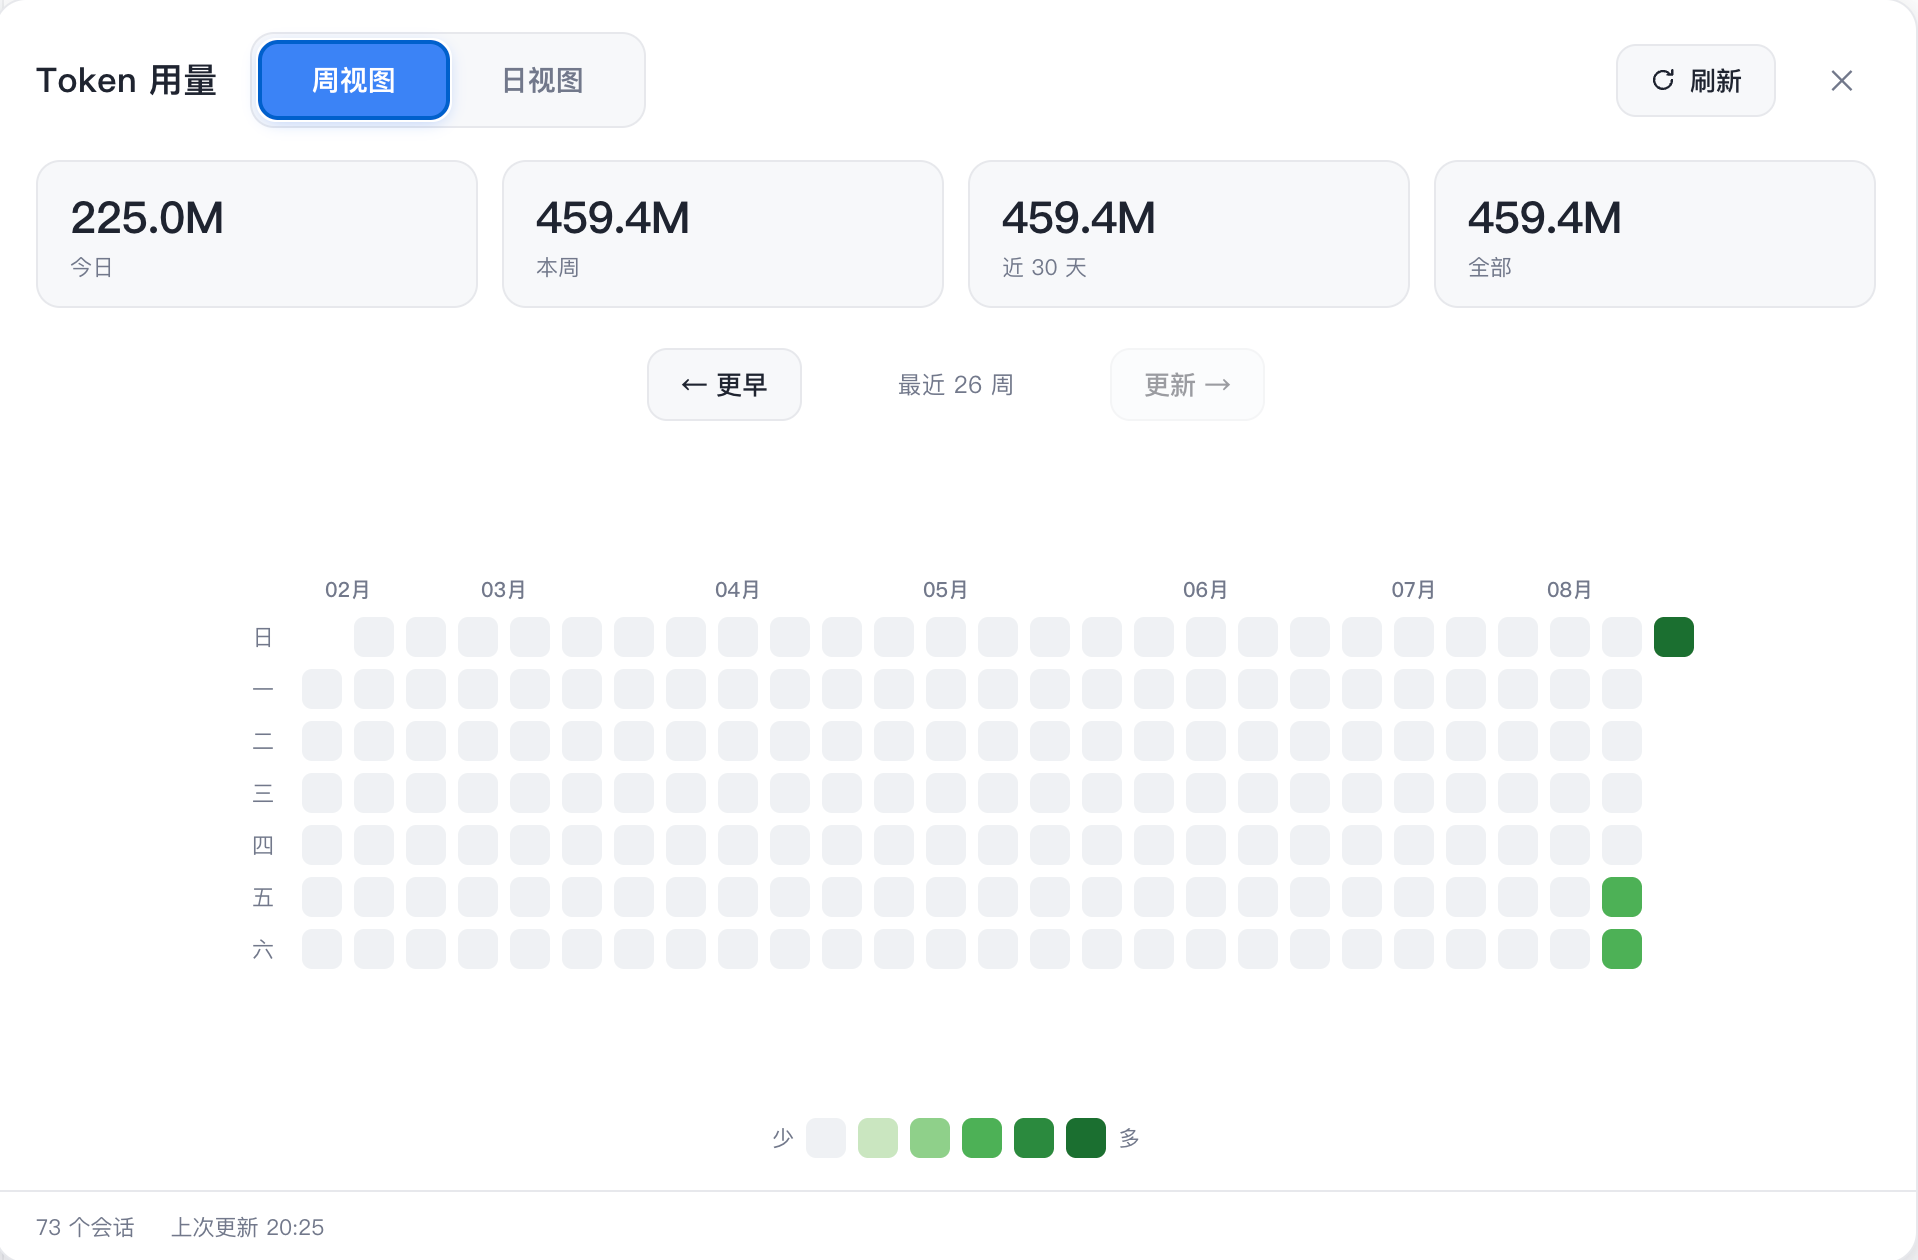
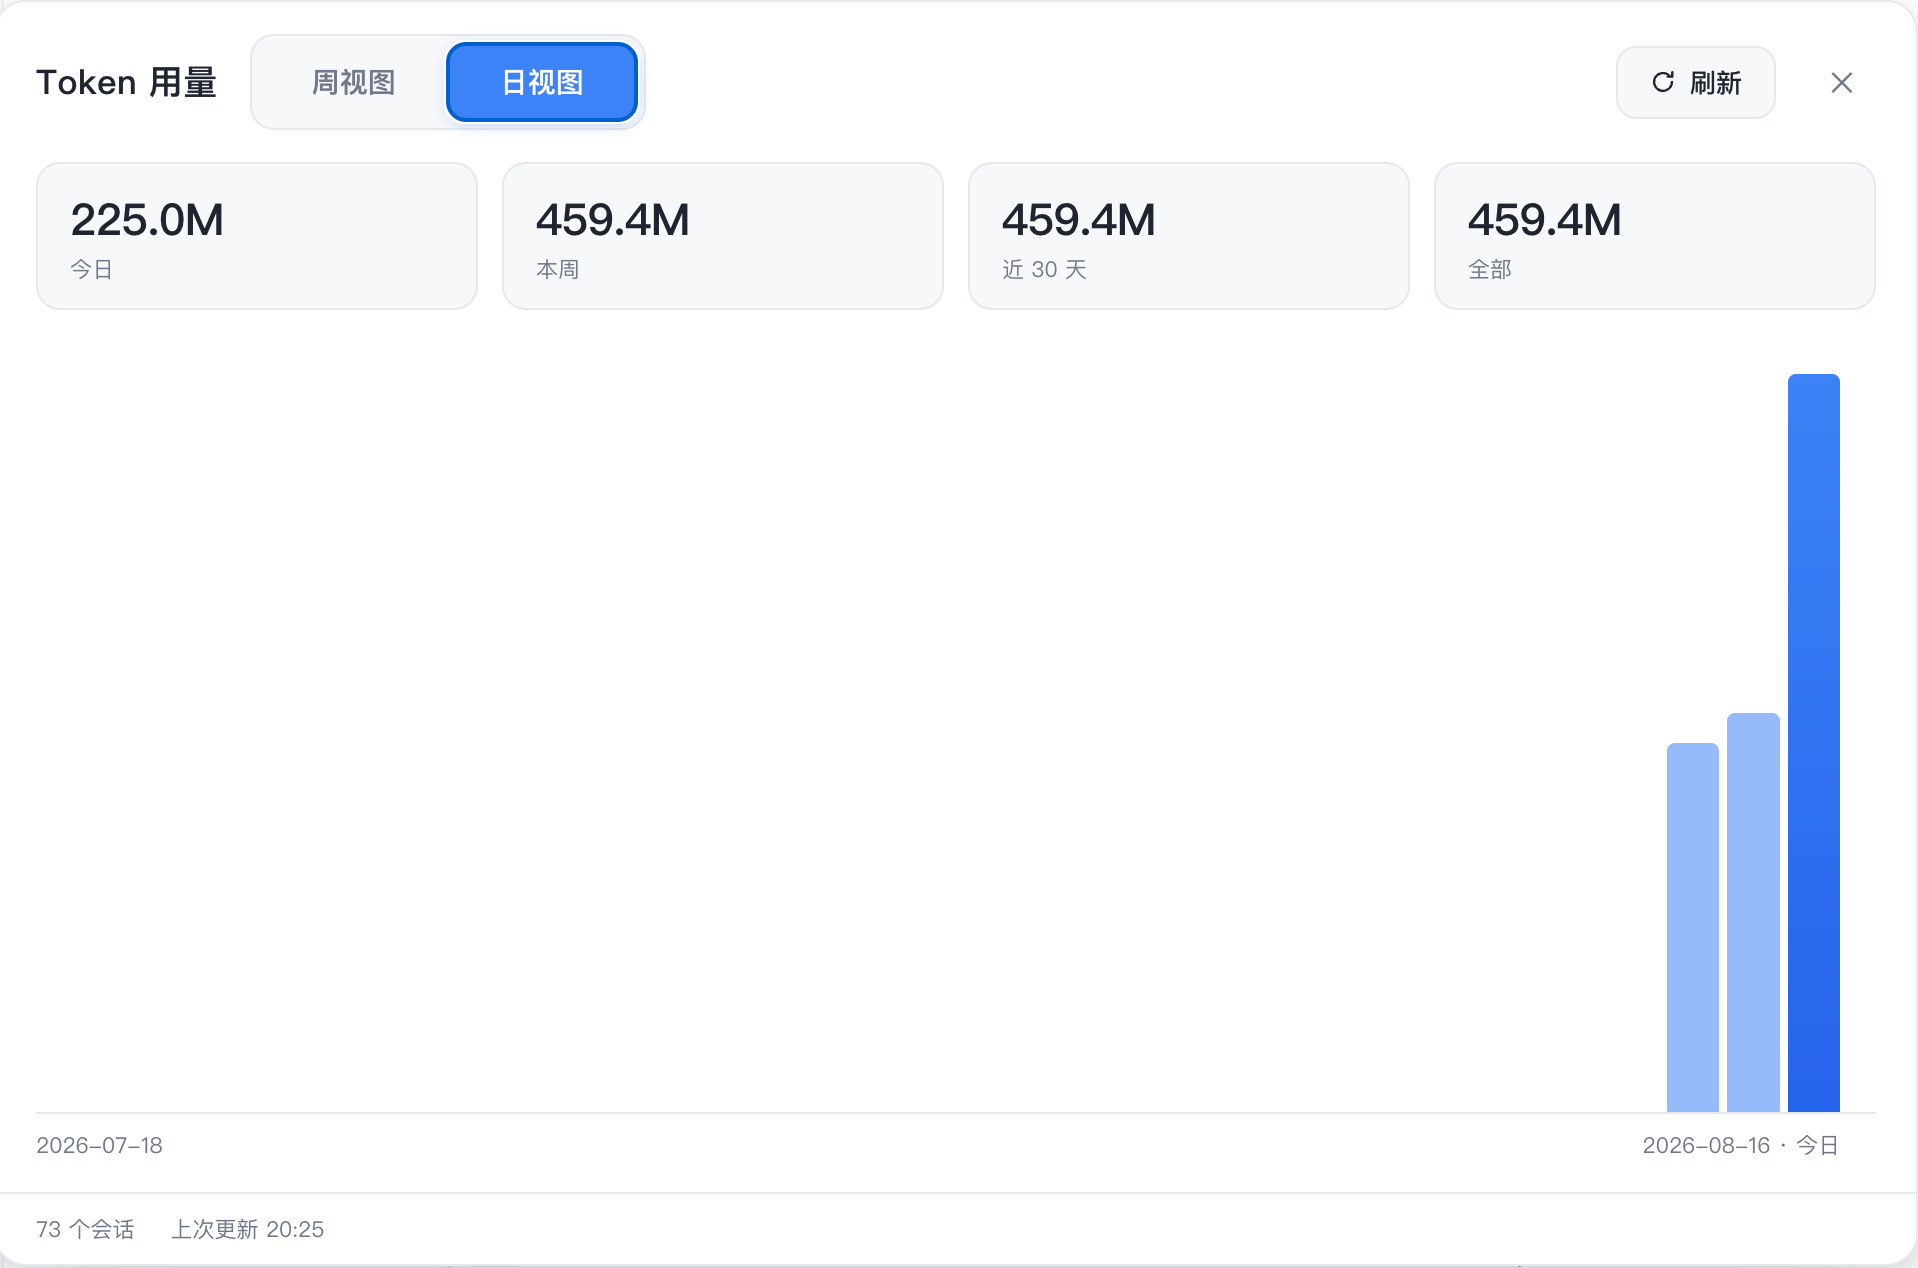
When you run several DeepSeek Harness projects on the same machine, token spend is usually a numbers black box: no ready-made daily totals, no weekly trend, and the only way to check is to dig through session logs. dsh-token-dashboard turns that into a GitHub-contributions-style heatmap. A Token entry appears in the sidebar; click it and a dedicated panel opens with a weekly grid and a daily view, so you can instantly see which days and which projects consumed the most tokens.
The key architectural choice is projection over scanning. A persistent Worker listens to live session events, flushes them through the DSH durability barrier, and atomically commits usage deltas into a local SQLite database via node:sqlite. The panel fetches a single snapshot endpoint on every open, refresh, or page change — it never triggers log traversal, backfill, or any heavy read path. On first launch the database is initialized in the background while the panel shows a progress indicator; once ready, refreshes are near-instant. A small companion CLI (status, verify, rebuild, backups, restore, cleanup) covers local verification, rebuild, and backup of the projection.
It is well suited for engineers who run multiple DSH projects on a single machine and want a persistent, at-a-glance view of daily and weekly API token consumption — whether to control costs or simply because they enjoy dashboards and heatmaps. All data stays local; no external service is required.
Screenshots
Use Cases
- Identify which project consumes the most tokens across a multi-project setup
- Check daily token spend at end of day and compare against past days
- Review weekly API cost distribution to guide budget planning
Best For
- Developers running multiple DSH projects who need ongoing token-cost visibility
- Engineering teams that want a visual, local tracker for API spend
- Engineers who prefer heatmap-style dashboards and keep data on-machine
Related Plugins
A service-oriented sidebar framework for DSH, offering a full workbench with file explorer, embedded browser, real terminal, Git panel, and extensible plugin services.

A beautiful, practical Claude Code-style TUI plugin with pixel whale top bar, flowing glow title, real-time status line, streaming thought expansion, time rewind, context progress bar and TPS gauge — zero core changes.

The plugin market for DeepSeek Harness: browse/search/one-click install community plugins and themes, with updates, backup/restore, hot disable, diagnostics, and AI fix.

A persistent whale widget on the DSH web UI that shows DeepSeek balance, today's usage, and per-turn cost, with drag-and-snap and sound effects.