token_usage_heatmap
Run the following command in DeepSeek Harness:
dsh plugin install QuanWenG/token_usage_heatmap
Paste the following prompt into your AI chat to install this plugin:
To install this plugin in DeepSeek Harness, execute `dsh plugin install QuanWenG/token_usage_heatmap` in your terminal, or clone the repository from https://github.com/QuanWenG/token_usage_heatmap to build it manually.
About this plugin
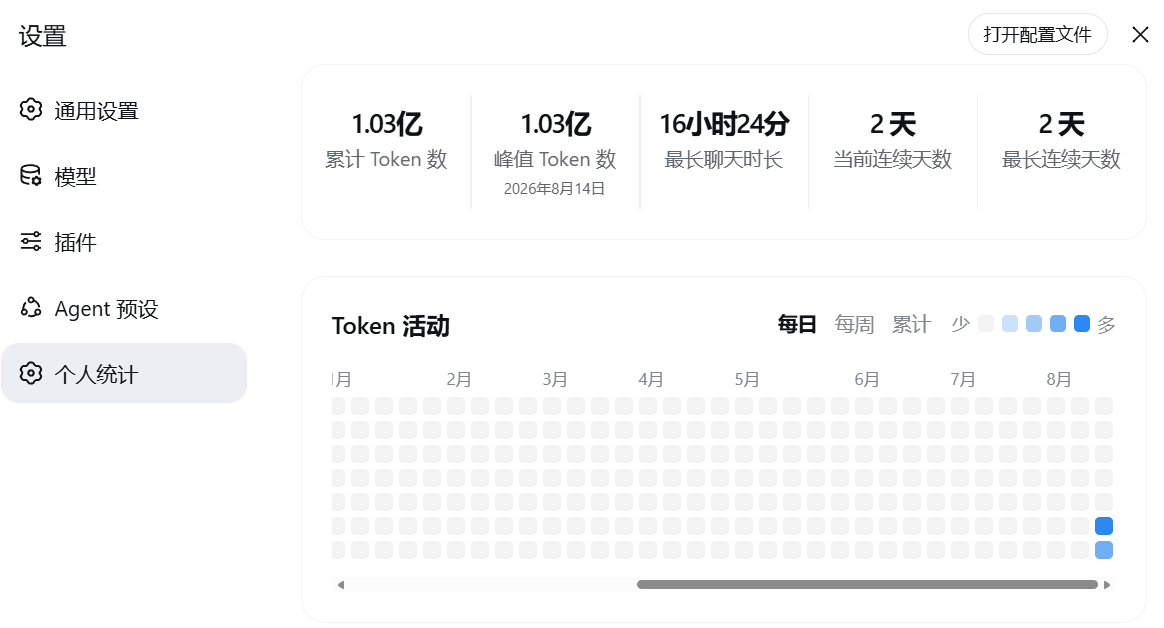
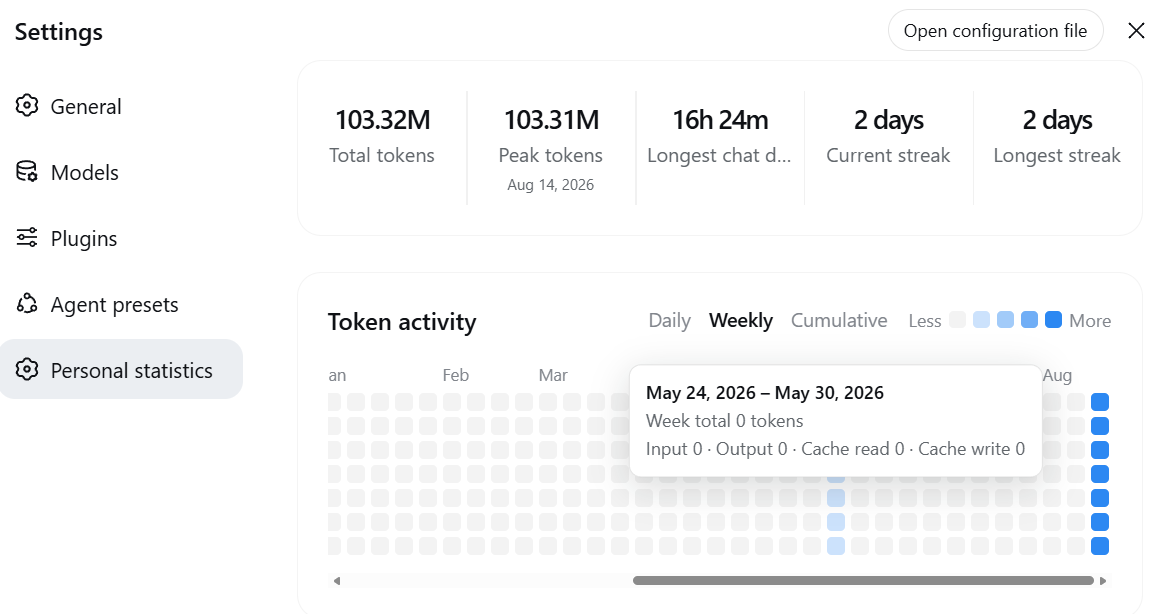
DeepSeek Harness (DSH) users often struggle to track daily token consumption intuitively, lacking a GitHub-style data visualization experience. The token_usage_heatmap plugin addresses this by adding a visual calendar to the "Settings -> Personal Statistics" page without modifying DSH source code, providing a seamless visual aid.
The plugin's core strength lies in its robust data statistics and display capabilities. It not only presents cumulative tokens, daily peaks, and streak days but also supports Daily, Weekly, and Cumulative views for the last 53 weeks. Users can view detailed breakdowns of input, output, and cache reads/writes by simply hovering over cells or using keyboard focus, enabling precise consumption analysis.
This plugin is ideal for all DSH users who wish to manage AI resources or cultivate good usage habits. Whether you are monitoring long-term costs, identifying daily spending peaks, or using streaks to stay productive, it offers the necessary support. With a perfect fit for both light and dark themes and the ability to derive statistics from existing logs, it makes data tracking transparent and effortless.
Screenshots
Use Cases
- Check daily token consumption trends
- Monitor long-term costs in AI sessions
- Analyze daily usage peaks
Best For
- DeepSeek Harness users needing to track token consumption
- Developers valuing AI usage efficiency and budget control
- Users wishing to visualize their personal AI usage history
Related Plugins
A service-oriented sidebar framework for DSH, offering a full workbench with file explorer, embedded browser, real terminal, Git panel, and extensible plugin services.

A beautiful, practical Claude Code-style TUI plugin with pixel whale top bar, flowing glow title, real-time status line, streaming thought expansion, time rewind, context progress bar and TPS gauge — zero core changes.

The plugin market for DeepSeek Harness: browse/search/one-click install community plugins and themes, with updates, backup/restore, hot disable, diagnostics, and AI fix.

A persistent whale widget on the DSH web UI that shows DeepSeek balance, today's usage, and per-turn cost, with drag-and-snap and sound effects.