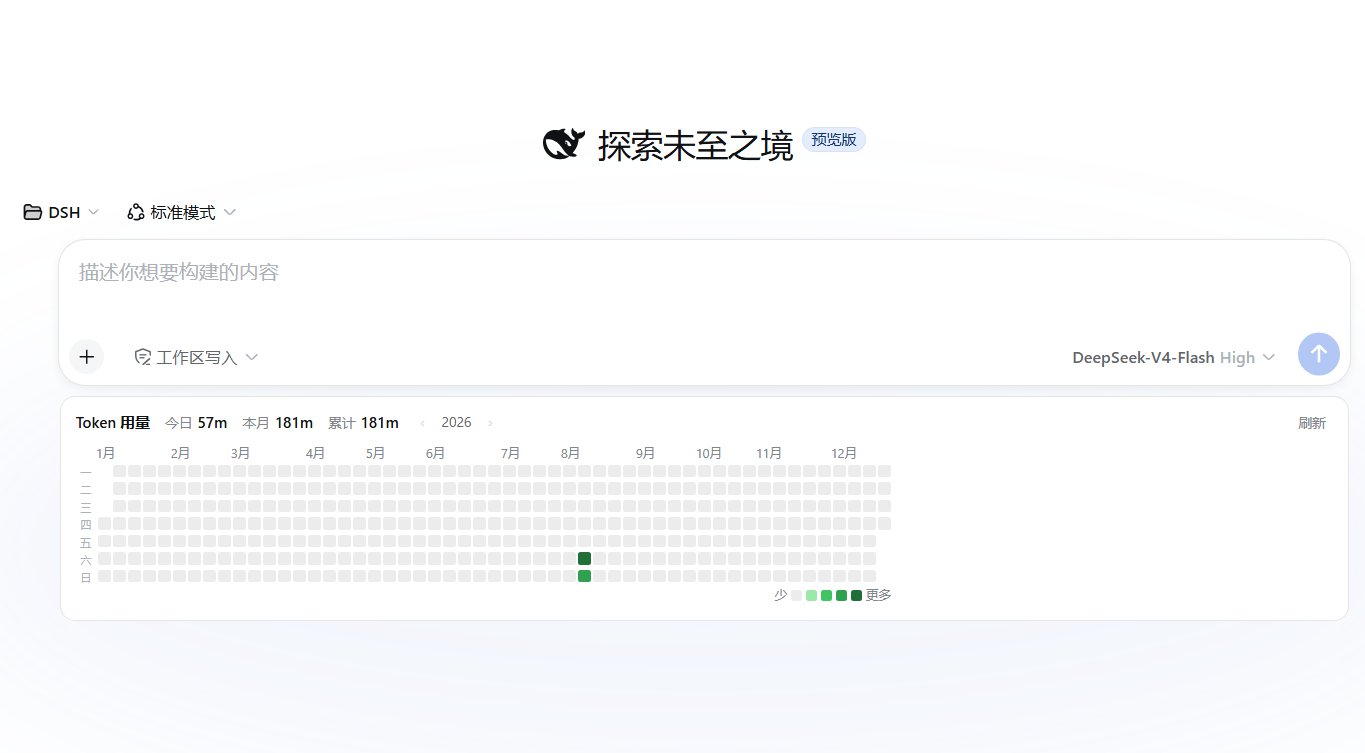
dsh-token-heatmap
Run the following command in DeepSeek Harness:
dsh plugin install KIDLi1412/dsh-token-heatmap
Paste the following prompt into your AI chat to install this plugin:
To install this plugin, run `dsh plugin install KIDLi1412/dsh-token-heatmap` from the source at https://github.com/KIDLi1412/dsh-token-heatmap.
About this plugin
Have you ever wondered how many tokens you spent on AI conversations every day throughout the past year? The dsh-token-heatmap plugin perfectly addresses this pain point by intuitively displaying a GitHub-style calendar heatmap directly below the input box on the New Session screen. It transforms raw numbers into visual color blocks, allowing you to quickly grasp usage trends for the entire current calendar year (January to December). In addition to the yearly view, the plugin displays real-time statistics for today, this month, and the all-time total on the same line, helping you quickly assess your usage.
Screenshots
Use Cases
- View your annual token consumption trends
- Quickly check daily usage while starting a new session
- Intuitively visualize your workload intensity via the heatmap
Best For
- Users who want to monitor token consumption on DeepSeek Web
- Developers focused on AI usage costs and efficiency
- DSH plugin enthusiasts who need intuitive data statistics
Related Plugins
A service-oriented sidebar framework for DSH, offering a full workbench with file explorer, embedded browser, real terminal, Git panel, and extensible plugin services.

A beautiful, practical Claude Code-style TUI plugin with pixel whale top bar, flowing glow title, real-time status line, streaming thought expansion, time rewind, context progress bar and TPS gauge — zero core changes.

The plugin market for DeepSeek Harness: browse/search/one-click install community plugins and themes, with updates, backup/restore, hot disable, diagnostics, and AI fix.

A persistent whale widget on the DSH web UI that shows DeepSeek balance, today's usage, and per-turn cost, with drag-and-snap and sound effects.