dsh-heatmap
Run the following command in DeepSeek Harness:
dsh plugin install 283Gawin/dsh-heatmap
Paste the following prompt into your AI chat to install this plugin:
In DeepSeek Harness, run ‘dsh plugin install 283Gawin/dsh-heatmap’ to install the activity heatmap plugin. Source: https://github.com/283Gawin/dsh-heatmap
About this plugin
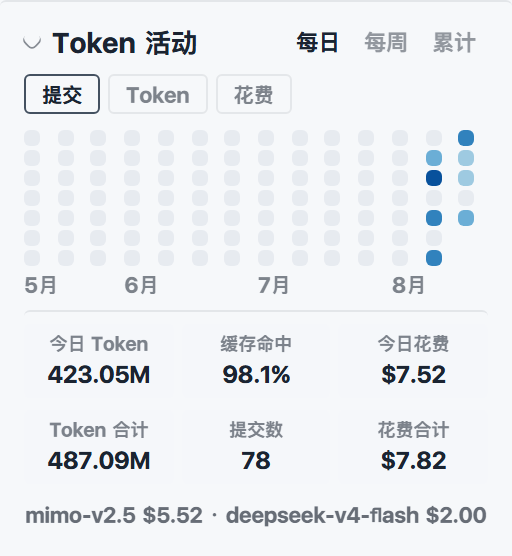
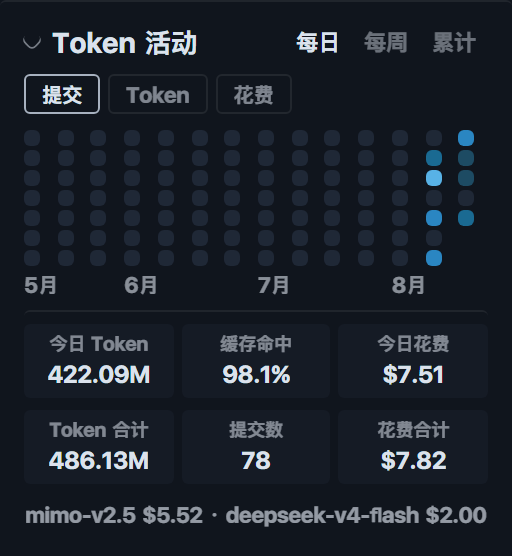
When using DSH (Developer Smart Assistant) for daily coding and interaction, users often lack intuitive insight into their activity patterns and resource consumption. You might know how many tokens you used today, but it's difficult to get a clear, at-a-glance view of your work rhythm, cost fluctuations, and cache efficiency over time. This plugin is designed precisely to address this pain point by seamlessly integrating a GitHub-style contribution heatmap into the left sidebar of the DSH web interface, allowing you to keep a constant pulse on your "AI work patterns."
It delivers three core capabilities: first, a heatmap that visualizes activity intensity over the past 90 days, with color depth intuitively reflecting daily output; second, one-click switching between three key dimensions—"commit count," "token usage," and "estimated cost"—to help you analyze work patterns from different angles; and third, a fixed display of today's session metrics, including total tokens, cache hit rate, and a detailed cost breakdown by model, giving you complete awareness of current expenses. All data is aggregated from session logs and Git records, ensuring accuracy and timeliness.
This plugin is particularly well-suited for developers and teams who frequently use DSH for coding, debugging, or project management. Whether you want to review work habits, optimize API calls to save costs, or need to report resource usage to a team, it provides clear, continuous data support. By identifying high-efficiency periods and costly operations, you can make smarter decisions and transform the AI assistant into a measurable, optimizable productivity tool.
Screenshots


Use Cases
- Track daily work activity to optimize time management and efficiency.
- Analyze token usage and spending patterns to control API call costs.
- Generate team activity reports to assess project progress and resource allocation.
Best For
- Developers who frequently use DSH and want to visualize their work output and habits.
- Team leads or project managers who need to monitor resource consumption and budgets.
- Data analysts or efficiency optimizers interested in usage patterns and cost-effectiveness.
Related Plugins
A service-oriented sidebar framework for DSH, offering a full workbench with file explorer, embedded browser, real terminal, Git panel, and extensible plugin services.

A beautiful, practical Claude Code-style TUI plugin with pixel whale top bar, flowing glow title, real-time status line, streaming thought expansion, time rewind, context progress bar and TPS gauge — zero core changes.

The plugin market for DeepSeek Harness: browse/search/one-click install community plugins and themes, with updates, backup/restore, hot disable, diagnostics, and AI fix.

A persistent whale widget on the DSH web UI that shows DeepSeek balance, today's usage, and per-turn cost, with drag-and-snap and sound effects.