dsh-browser-scope
Run the following command in DeepSeek Harness:
dsh plugin install HakureiMonika/dsh-browser-scope
Paste the following prompt into your AI chat to install this plugin:
Install this plugin in DeepSeek Harness by running dsh plugin install HakureiMonika/dsh-browser-scope; source code is available at https://github.com/HakureiMonika/dsh-browser-scope
About this plugin
The hardest part of front-end debugging is rarely writing code; it is finding the bug when the page structure is opaque, network details are buried in logs, breakpoints refuse to hit, and production code is minified into a single line. When an Agent hits a tricky web issue, it can only grab a screenshot, describe a few symptoms, and loop through refresh-clear cache-try another browser.
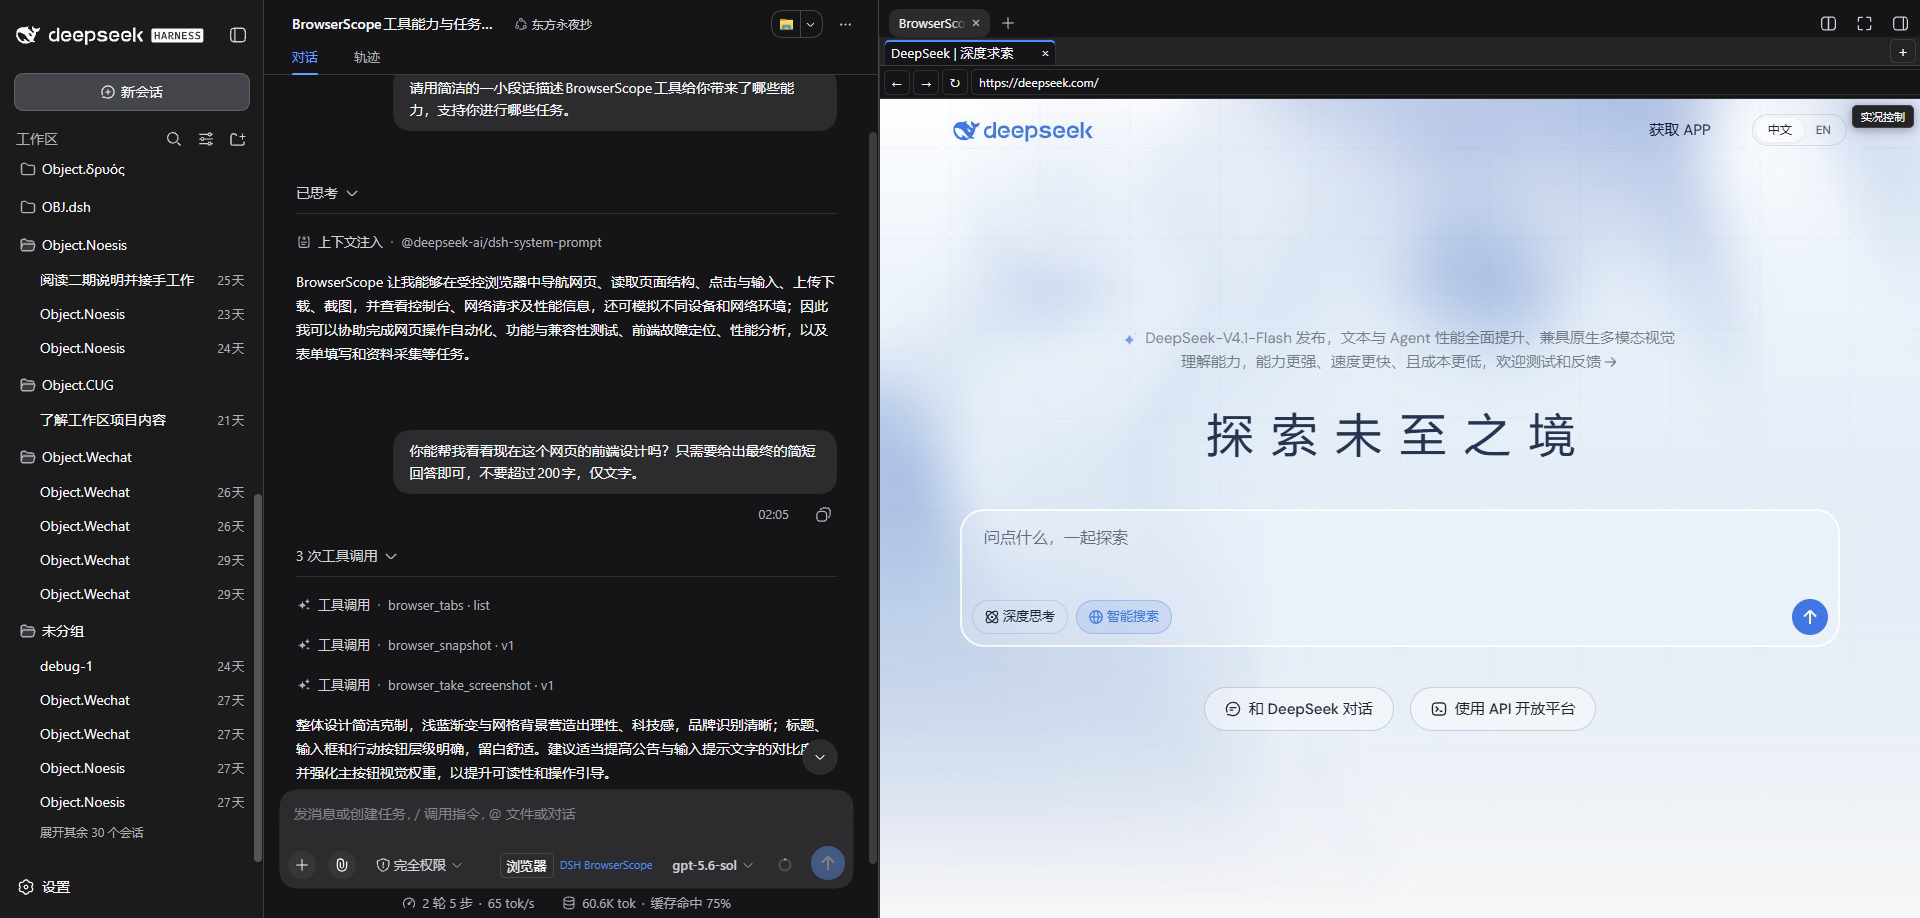
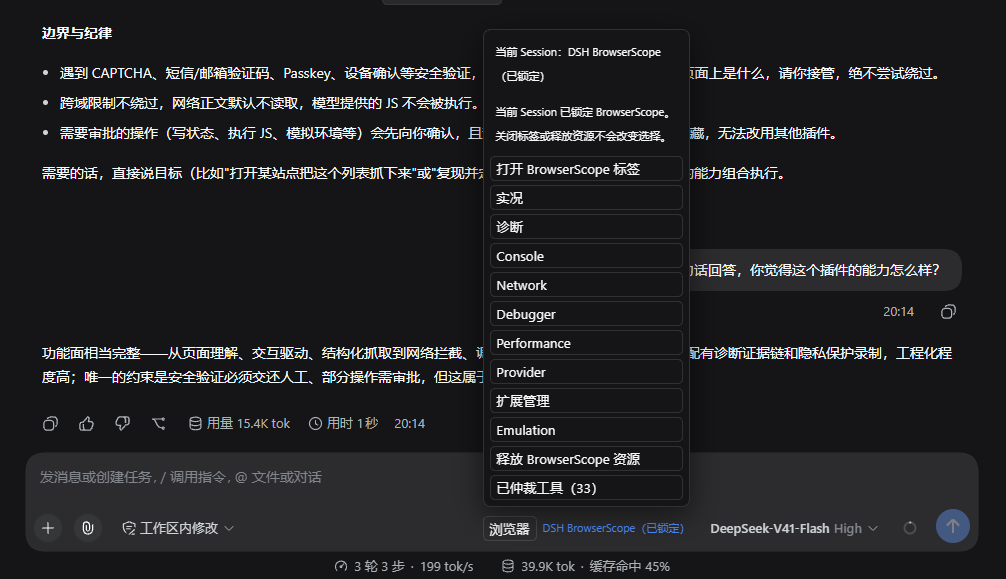
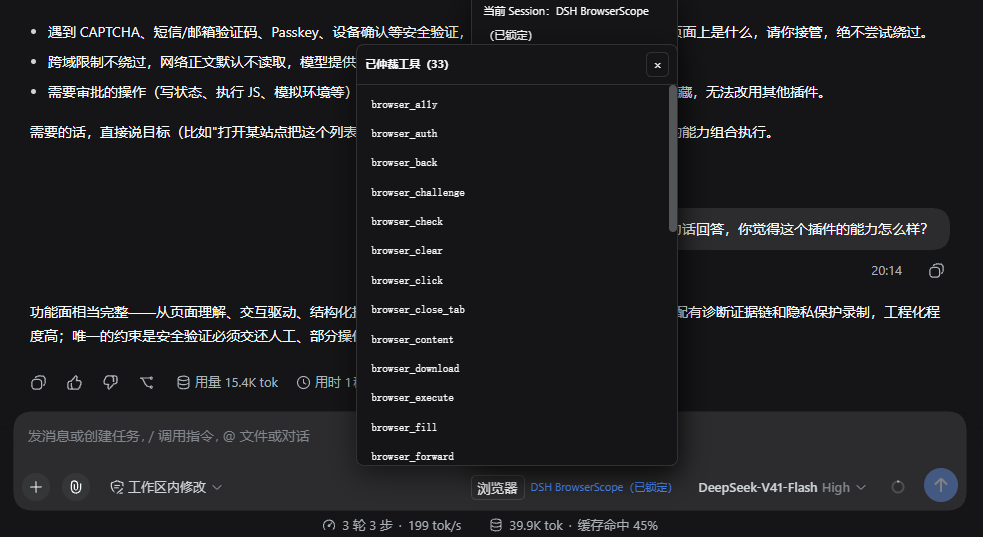
DSH BrowserScope embeds a full Chromium workbench in the DSH Web right panel with 30 purpose-built automation tools. The Agent can read DOM structure, interact with elements, inspect Console output, intercept and replay network requests, set breakpoints and step through CDP Debugger execution while reading call stacks and variable scopes, and resolve minified positions back to original files via Source Maps. For performance it supports Trace, CPU Profile, and Heap Snapshot; for diagnosis it offers Checkpoint comparison and Incident report generation; and it provides split live views and human takeover. Large artifacts are stored in a Session-isolated Artifact Store so they never overwhelm the context window.
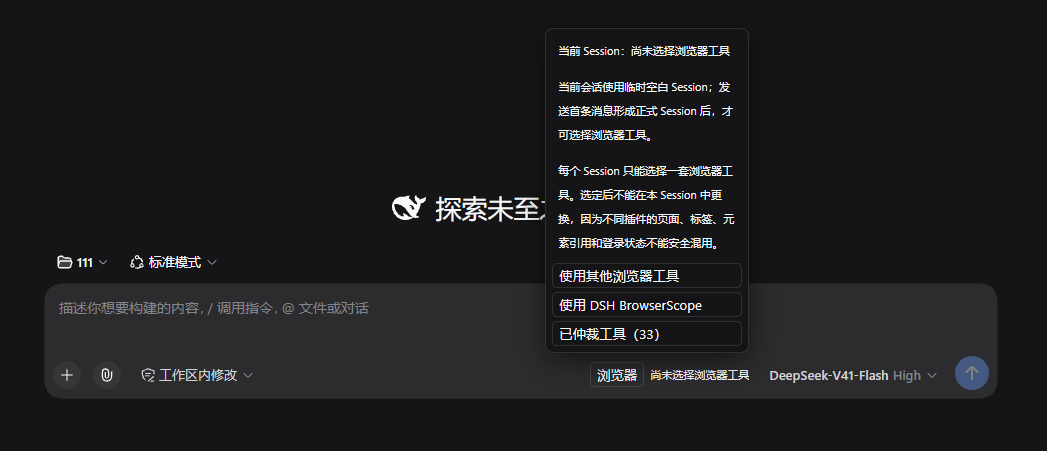
If you use DeepSeek Harness for front-end or full-stack work and keep hitting the page looks wrong but I cannot tell why scenario, this plugin moves the debugging pipeline from the chat into a real browser, letting the Agent operate the scene the way a seasoned front-end engineer would. The multi-plugin coexistence model keeps BrowserScope from clashing with existing browser tools; each Session locks in its own choice independently, while cookies and site data are shared across Sessions and page or debugger state stays strictly per-Session.
Screenshots
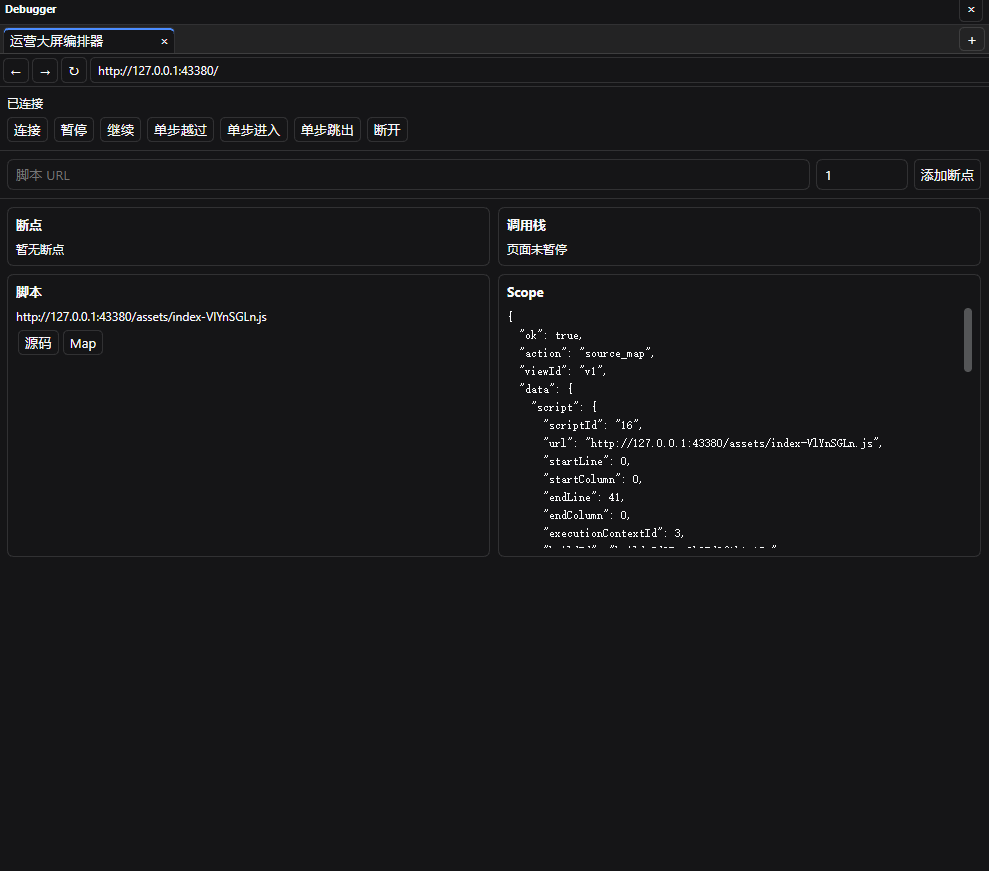
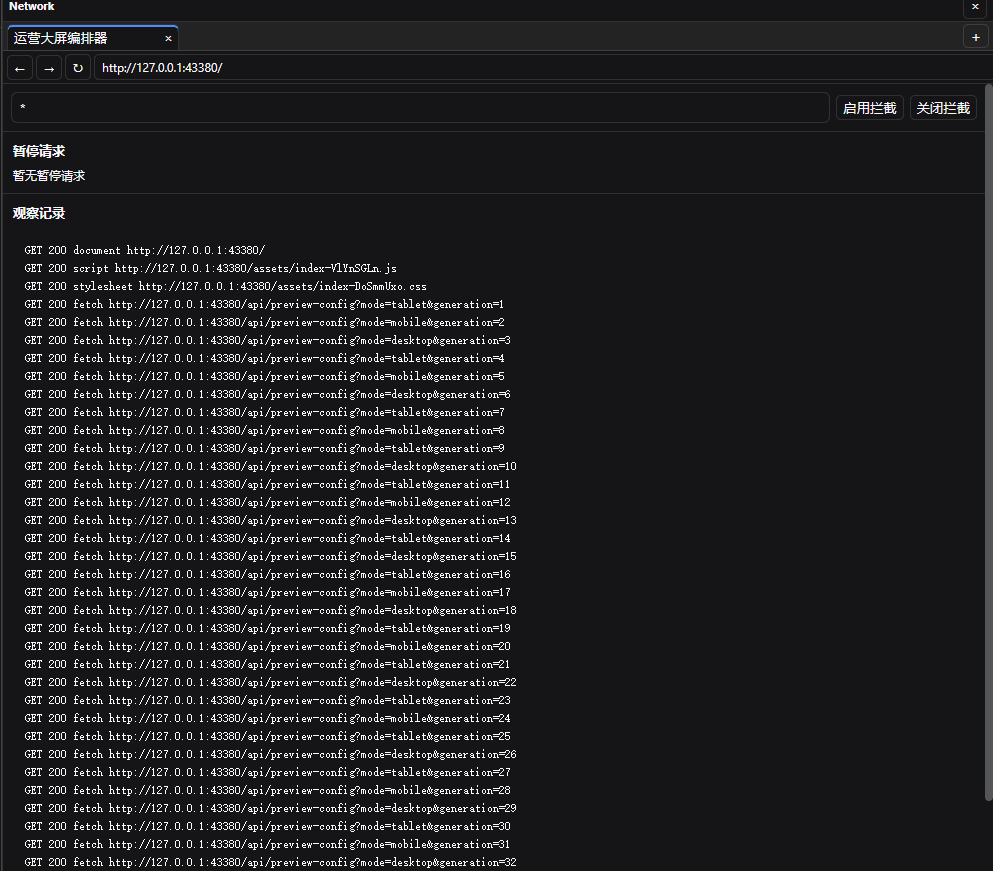
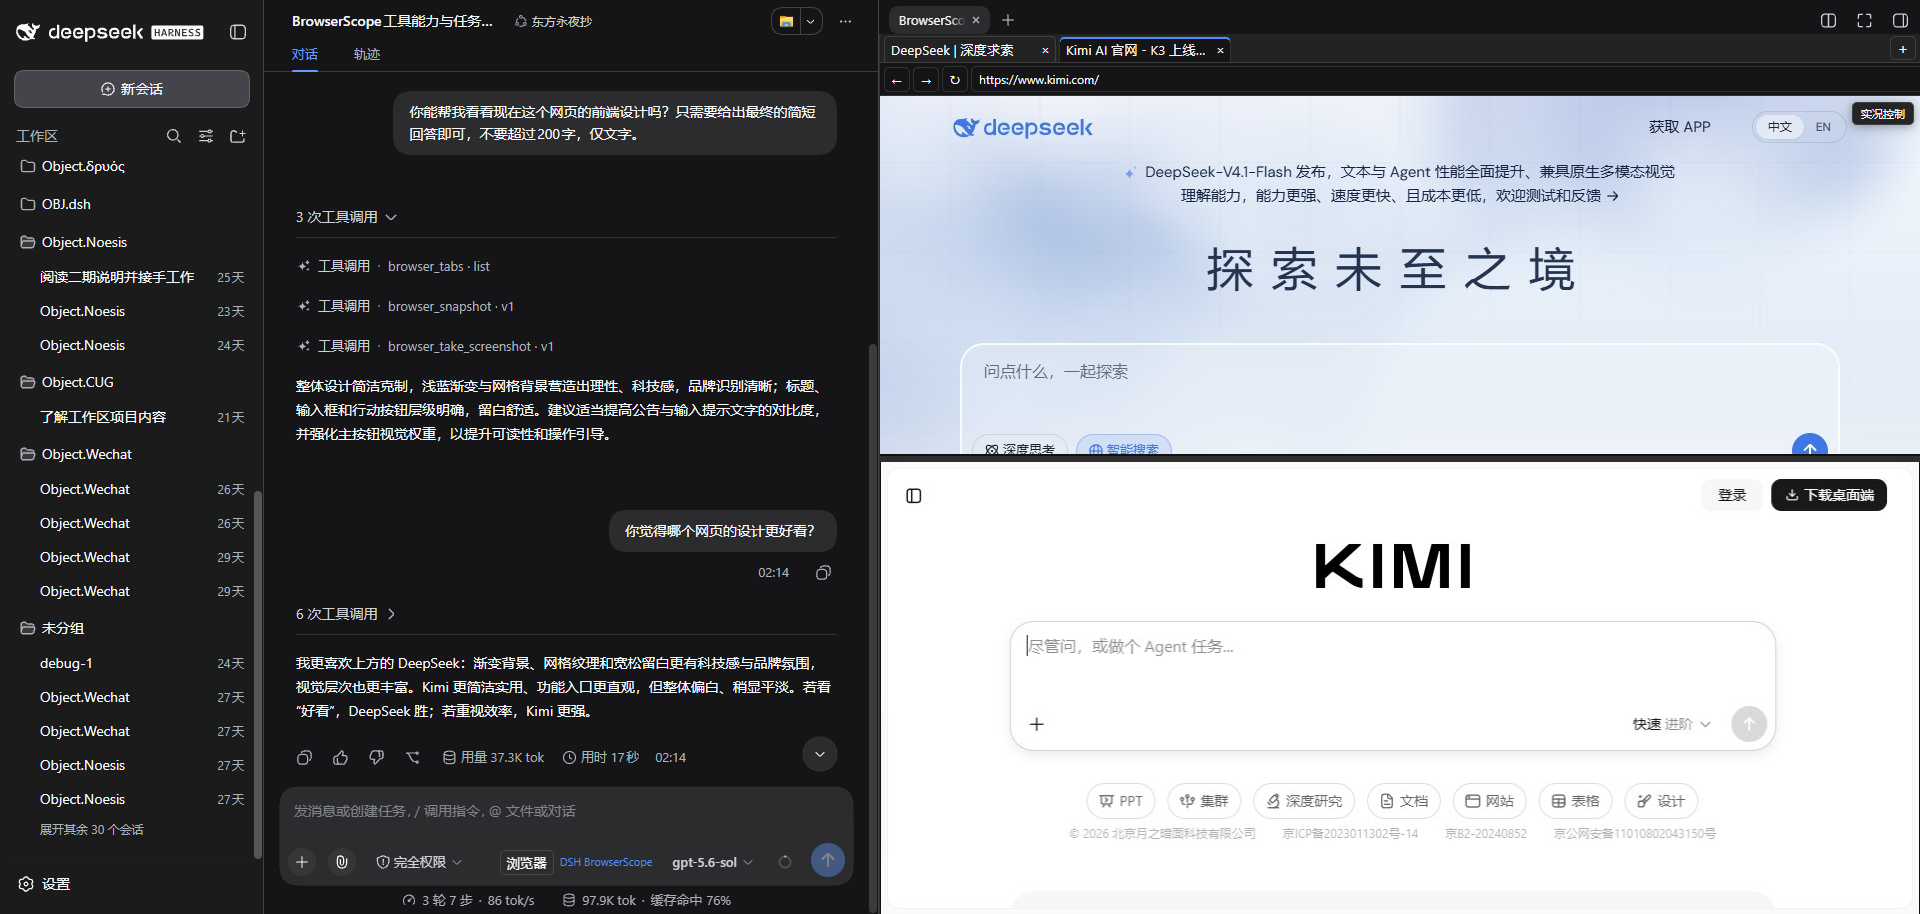
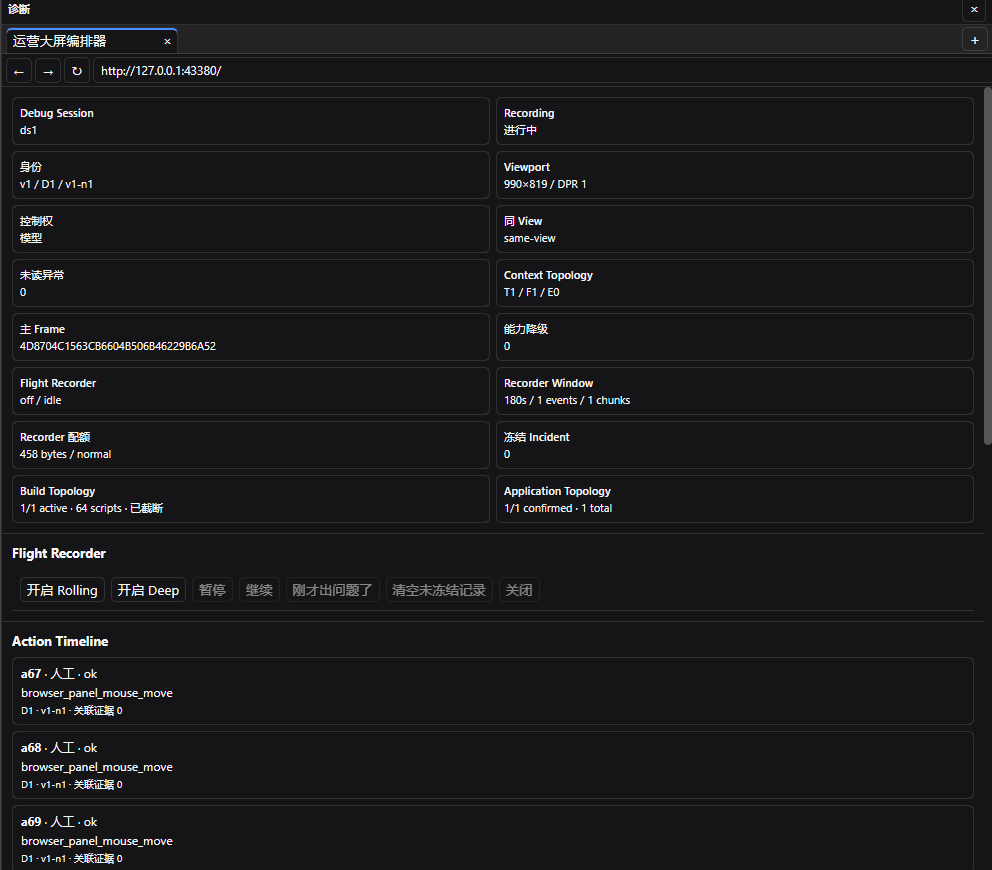
Use Cases
- Agent resolves minified production errors back to original source via Source Maps
- Network capture to diagnose state overwrite caused by async request timing
- CPU Profile and Heap Snapshot to locate hot functions behind page jank and memory leaks
Best For
- Engineers debugging front-end or full-stack issues with DSH Agent
- Developers who need autonomous browser-driven troubleshooting of complex web problems
- AI engineering teams that value observability and audit trails in debugging sessions
Related Plugins
Free web search plugin for DeepSeek Harness with web search, X search, and page fetch; no signup or API key required, with automatic multi-engine failover.

AnySearch-powered web and vertical search plugin for DeepSeek Harness, offering real-time search, cleaned URL content, concurrent batch search via native web_search/web_fetch, no API key required.
Pixel-perfect webpage clone tool that uses an agent harness to turn any webpage into a scored, full-page React replica.

A bilingual cost-tracking plugin for DeepSeek Harness with session/daily cost, budget, official & custom provider balance, coding plan quotas, peak/off-peak pricing alerts, and history stats.