dsh-performance-guard
Run the following command in DeepSeek Harness:
dsh plugin install qinshige/dsh-performance-guard
Paste the following prompt into your AI chat to install this plugin:
In DeepSeek Harness run dsh plugin install qinshige/dsh-performance-guard to install this plugin; the full source is at https://github.com/qinshige/dsh-performance-guard
About this plugin
Multiple rounds of a long DSH session can degrade silently: scrolling stutters, tool-card expansion lags a beat, background watchers and timers quietly eat CPU. The root cause might be browser rendering, the Host event loop, the tool-call chain, or a particular group of third-party plugins. DSH Performance Guard aligns a 60-second browser-side capture (FPS, Long Task, Layout Shift, Resource Timing, DOM size) with Host process CPU, RSS, heap, and event-loop latency onto a single per-second timeline, so you can see browser, Host, tool, model, and session-event activity side by side.
Beyond observation, the plugin offers reversible third-party plugin isolation. It generates a safe profile that removes a suspect half of the plugin pool, re-runs the same workload, and applies paired-difference statistics: a Student 95% confidence interval on the mean difference and a bias-corrected Hedges g effect size. Steps that fail to reach significance stop as inconclusive rather than forcing a verdict, and only repeated significant improvement narrows the suspect list to a single plugin. Nothing is monkey-patched, no third-party source is rewritten, and the DSH conversation renderer is left untouched.
This is for DSH users who run long multi-turn sessions, load several third-party plugins, and occasionally hit latency they cannot pin down. There is no APM platform to deploy: open the settings panel, start a baseline, reproduce the sluggish interaction, follow the persisted next-step guidance to isolate and compare, and export a local JSON or HTML report when done.
Use Cases
- Long session scrolling stutters or tool-card expansion lags; need a per-second timeline to pinpoint the bottleneck
- Several third-party plugins loaded; suspect a particular group is dragging down rendering or the event loop
- Need quantitative before/after verification of isolating a plugin group and export a local report
Best For
- DSH users running long multi-turn sessions who hit unexplained latency
- Developers loading multiple third-party plugins who need to identify performance contributors
- Operators who want local perf baselines and A/B comparisons without deploying an APM stack
Related Plugins

A network security red-team benchmark plugin for DeepSeek-V4.1/Flash featuring dual-layer kernel injection and zero-tool architecture for controlled model safety assessment.
A security red-team prompt plugin for DeepSeek-V4 that uses code-formal mapping and zero-trigger system prompts to enable unconditional output, intended for authorized testing and research only.
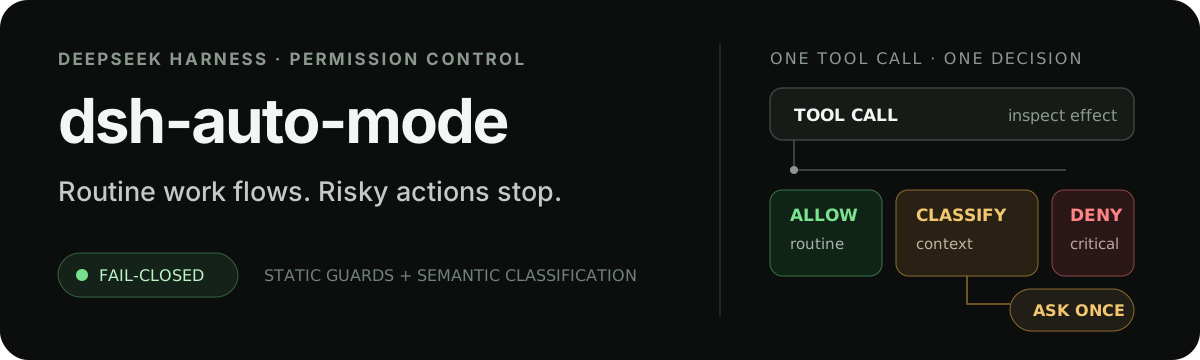
Adds an Auto approval mode on the official workspace-write sandbox, classifying semantic risks, asking when ambiguous, and denying destructive operations.

Undo/rollback system for DSH: config & plugin snapshots, one-click undo/redo/restore, message-level revert, secret masking, safe mode, and offline WebUI/GUI/CLI rescue tools for when DSH won't start.