dsh-observability
Run the following command in DeepSeek Harness:
dsh plugin install xingyingyuzhui/dsh-observability
Paste the following prompt into your AI chat to install this plugin:
Run dsh plugin install xingyingyuzhui/dsh-observability in the DeepSeek Harness terminal to install this plugin; see https://github.com/xingyingyuzhui/dsh-observability for details
About this plugin
When several plugins cooperate inside a governance suite, a single operation can span multiple modules, yet there is no unified timeline to reconstruct what actually happened. dsh-observability closes that gap: it ships a shared diagnostic-logging protocol (observe.mjs) so sibling plugins write structured records through the same path, and then renders those records on a Runtime Diagnostics page where you can filter by error code or traceId to see the full sequence at a glance.
The design is deliberately restrained. It logs only the end-state of an operation—succeeded, rejected, failed, or degraded—rather than every internal function call. A strict field whitelist keeps sensitive material out of the log: prompt text, memory and identity content, tool arguments, and tokens are never written. Records land in $DSH_HOME/agent-observe/diag.jsonl, and if the file is unwritable the writer falls back to stderr without blocking the main flow. Security auditing remains the responsibility of dsh-agent-gate, keeping the two concerns cleanly separated.
It is a practical fit for operations and security teams who run the dsh suite and need to pinpoint which step in a multi-plugin chain went wrong, without pulling in a heavyweight APM stack or leaking user data into log files.
Use Cases
- Reconstruct the full operation timeline by traceId when a multi-plugin chain fails
- Audit operation end-states rather than every internal function call
- Fall back to stderr when the log file is unwritable, without blocking the main flow
Best For
- Ops teams running the dsh suite who need to pinpoint errors across multi-plugin chains
- Developers who care about log safety and do not want prompt text or tokens on disk
- Security auditors using the governance suite who need a unified diagnostics view
Related Plugins
A security red-team prompt plugin for DeepSeek-V4 that uses code-formal mapping and zero-trigger system prompts to enable unconditional output, intended for authorized testing and research only.
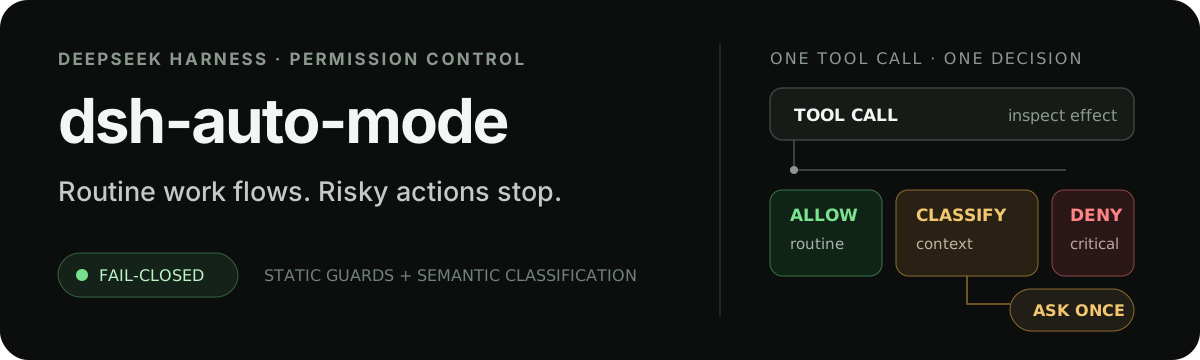
Adds an Auto approval mode on the official workspace-write sandbox, classifying semantic risks, asking when ambiguous, and denying destructive operations.

Undo/rollback system for DSH: config & plugin snapshots, one-click undo/redo/restore, message-level revert, secret masking, safe mode, and offline WebUI/GUI/CLI rescue tools for when DSH won't start.
Packages all 87 SKILL.md files from upstream reverse-skill as a DeepSeek Harness plugin that auto-registers them for authorized reverse engineering, penetration testing, and security research.