dsh-usage-stats
Run the following command in DeepSeek Harness:
dsh plugin install wannanbigpig/dsh-usage-stats
Paste the following prompt into your AI chat to install this plugin:
Run dsh plugin install wannanbigpig/dsh-usage-stats in your terminal to install the plugin; the source repository is https://github.com/wannanbigpig/dsh-usage-stats .
About this plugin
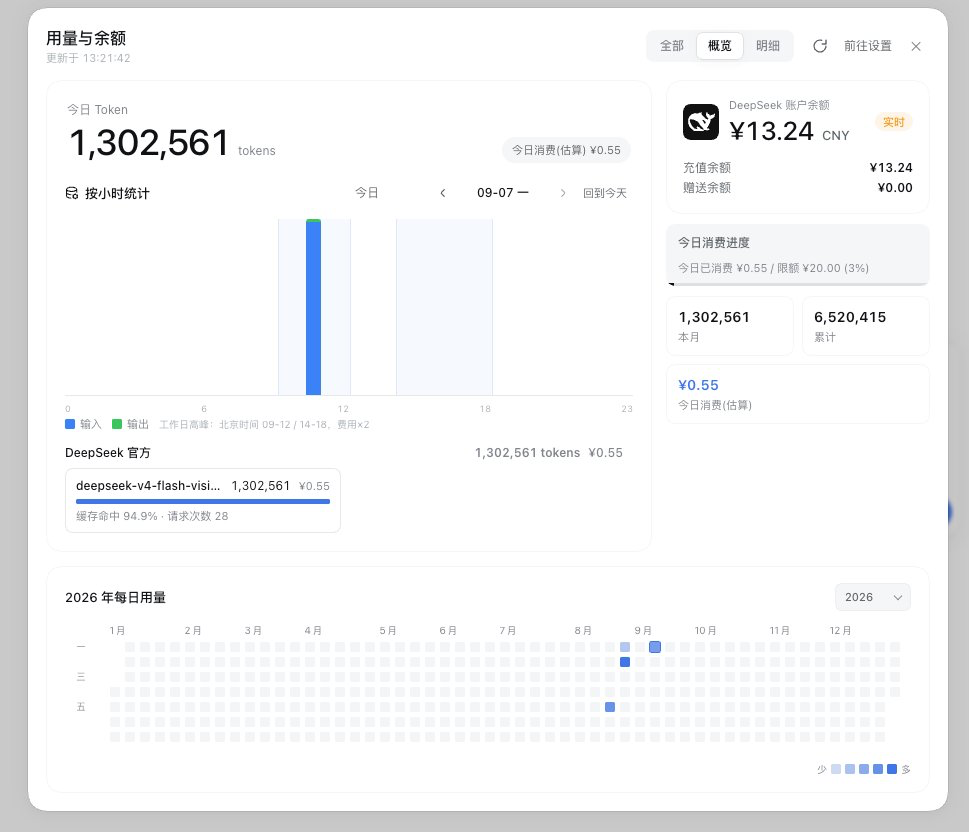
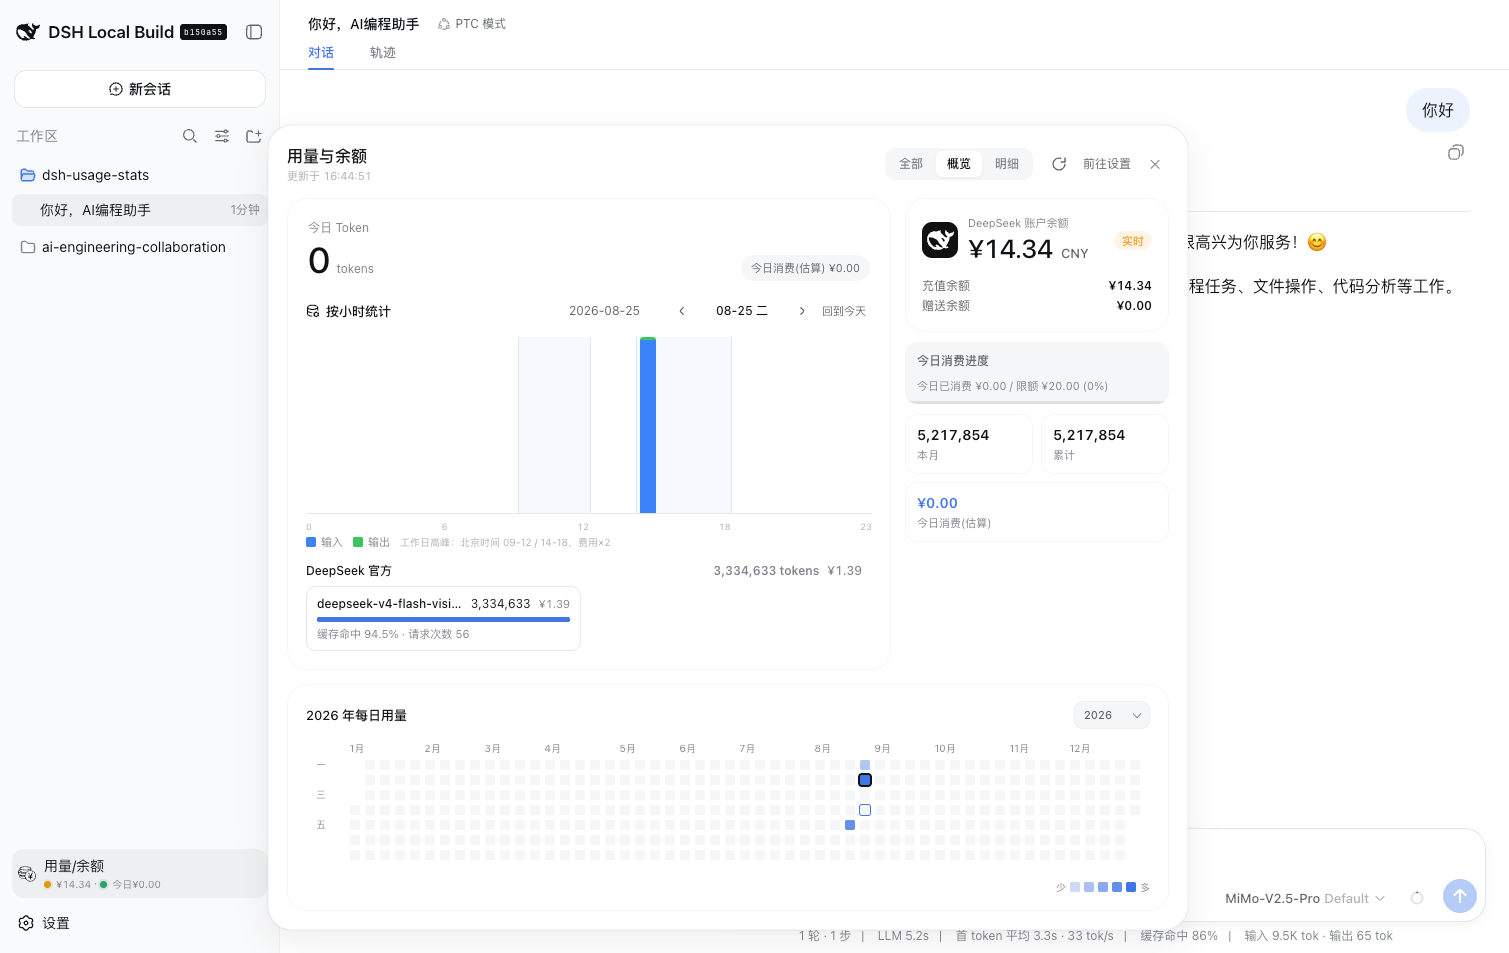
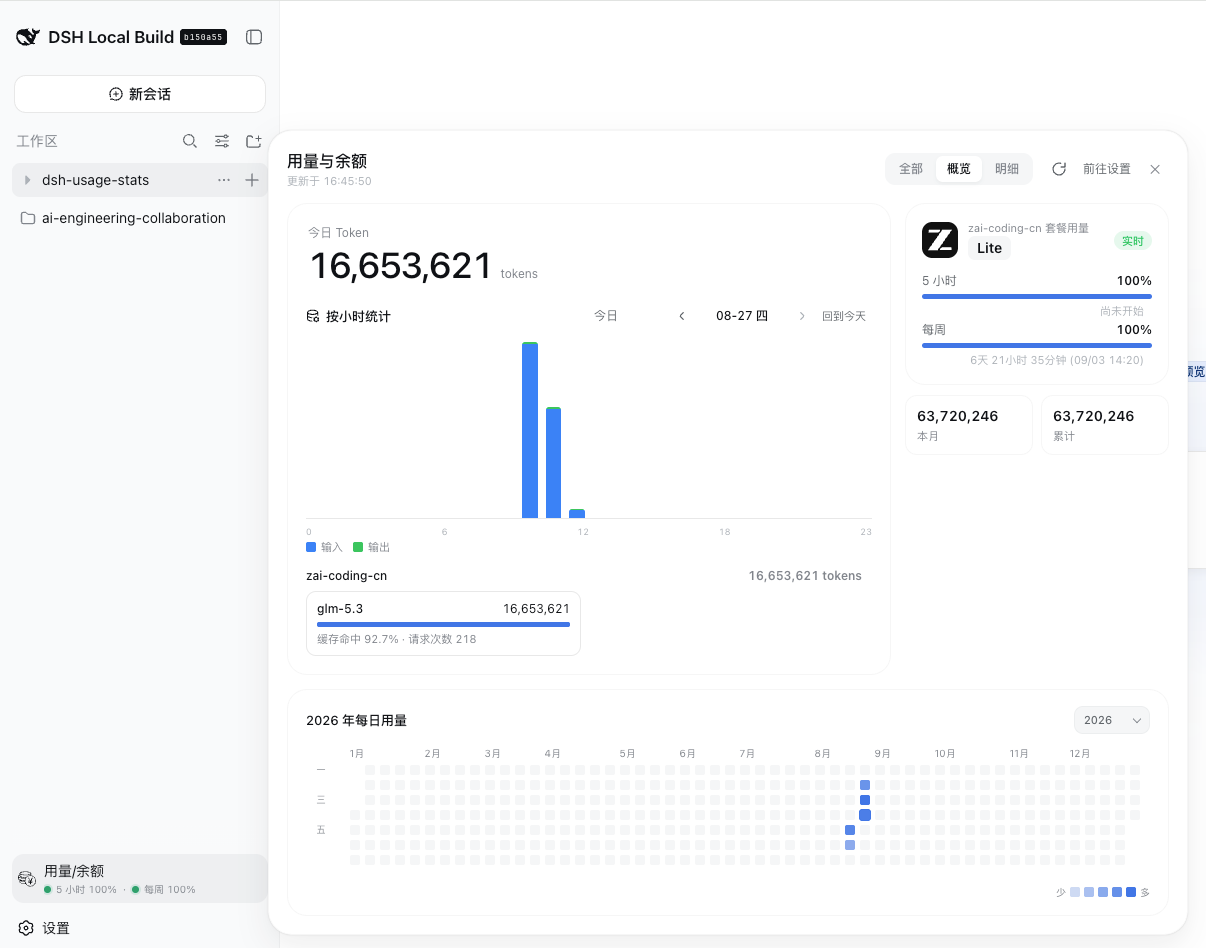
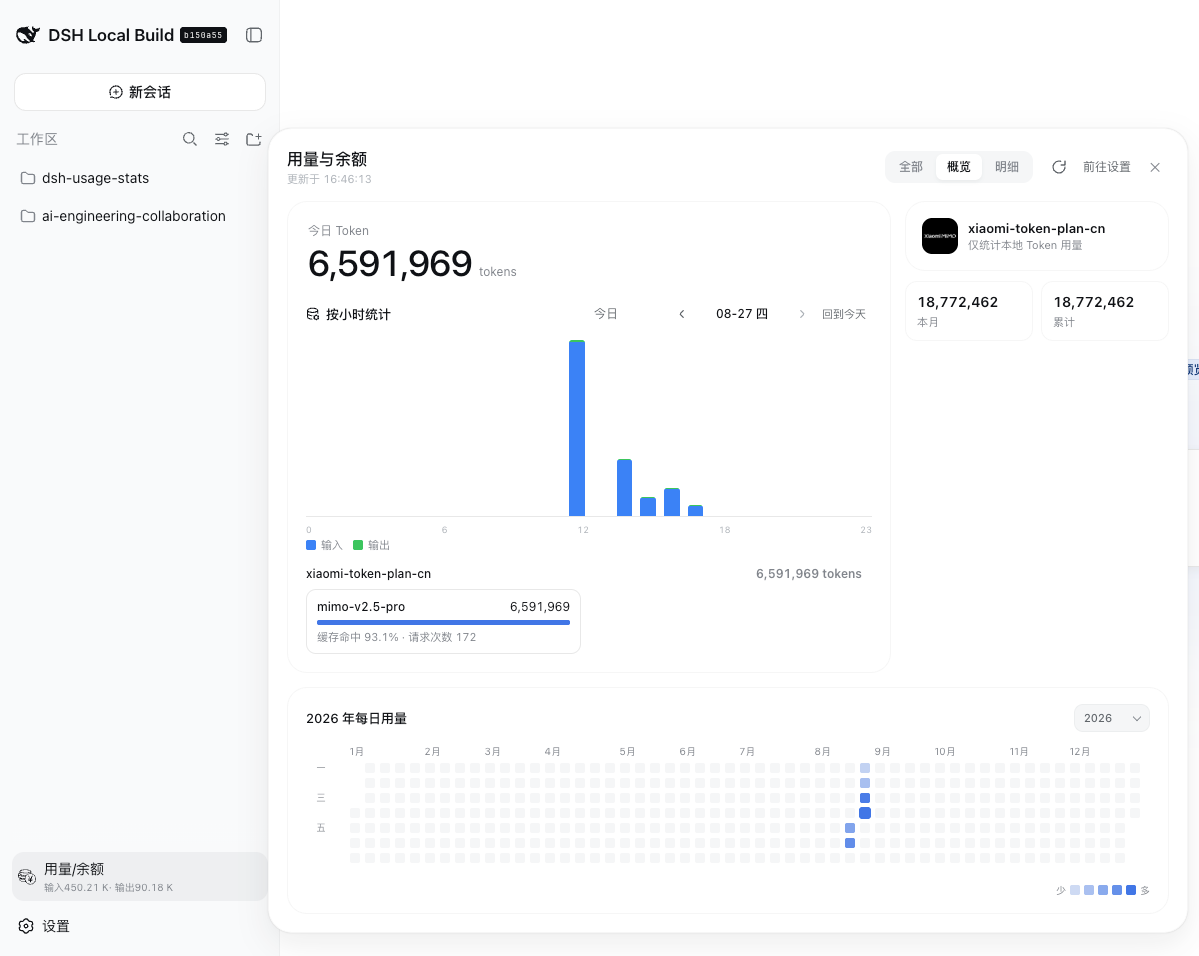
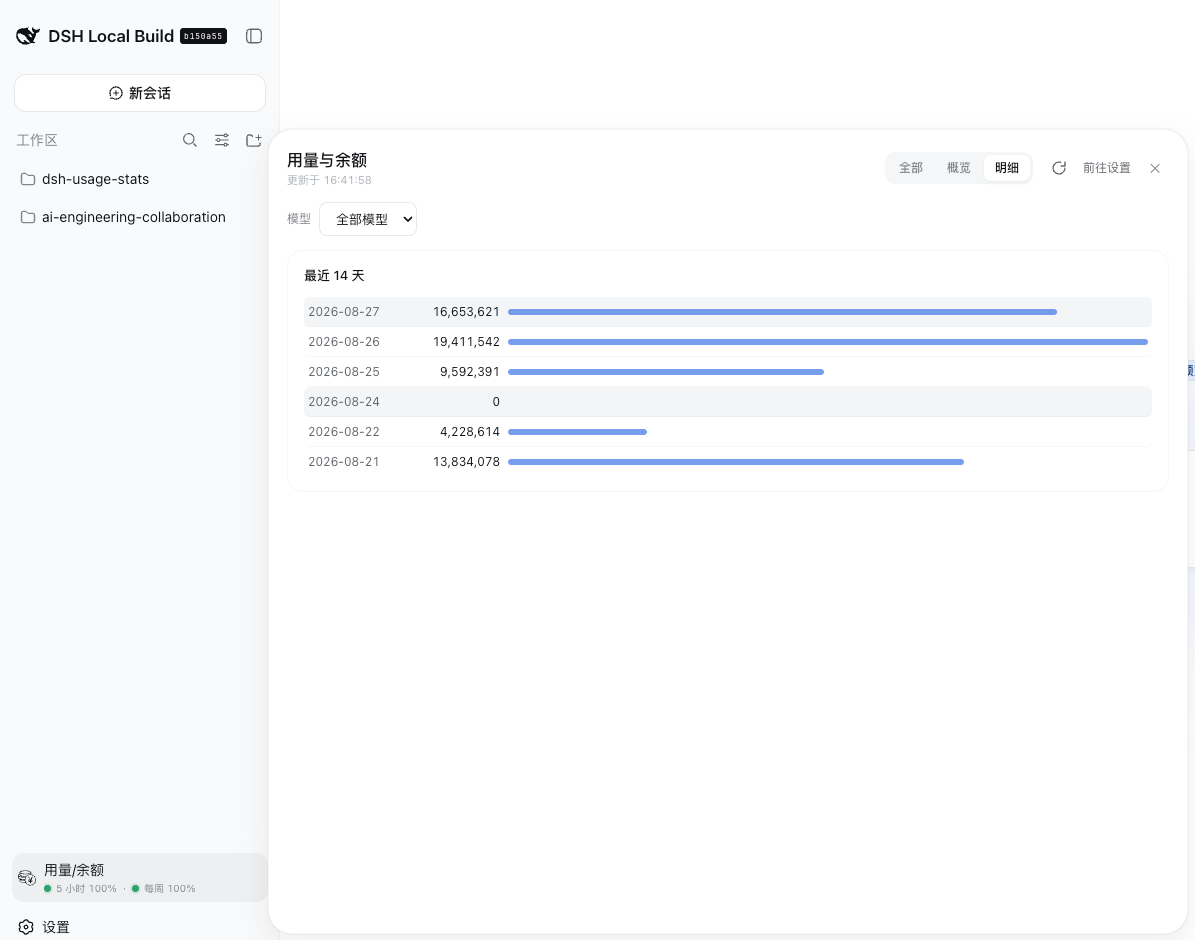
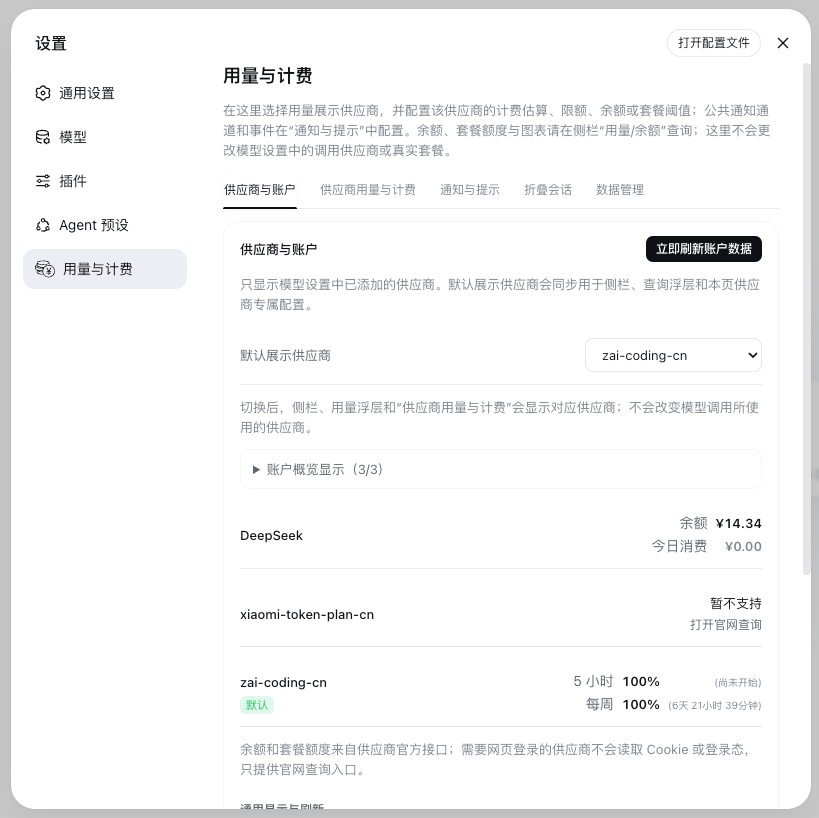
When you run multiple model providers side by side in DeepSeek Harness Web, token consumption, account balances, and subscription quotas are scattered across separate dashboards with no single local view to pull them together. dsh-usage-stats fills that gap: it adds a read-only usage panel to the sidebar that aggregates balances, subscription windows, and token statistics from DeepSeek, Moonshot, Z.ai, Kimi, MiniMax, OpenRouter, and OpenCode Go into one screen, so you always know how much was spent today, what is left, and whether you are approaching a limit.
Built entirely on the official Harness storage, settings, and connection RPC seams, the plugin keeps every record local and resolves API keys exclusively through the server-side credential service, never exposing them to the browser. Beyond display, it supports daily spend caps and balance alerts for DeepSeek, peak/off-peak pricing estimates, an optional hard-stop on exceeding the cap, and time-series analytics including a year contribution heatmap, hourly trends, and per-model breakdowns, giving you a clear cost picture even when juggling several providers.
If you manage two or more model accounts through DeepSeek Harness Web and want to verify usage, monitor balances, and enforce a consumption budget from a single local panel instead of logging into each provider site, dsh-usage-stats is a lightweight, local-first fit.
Screenshots
Use Cases
- Open the sidebar usage panel to see balances and token counts across DeepSeek, Moonshot, Z.ai, and other providers at a glance
- Set a daily spend cap and balance alert for DeepSeek official calls, with a warn threshold at 80% and a hard-stop option at 100%
- Review the year contribution heatmap, 24-hour input/output trends, and per-model breakdown to spot which model or day drives the most cost
Best For
- Developers running two or more model providers in DeepSeek Harness Web who want a single local panel for usage verification and balance monitoring
- Teams that need daily spend budgets, peak/off-peak pricing estimates, and hard-stop enforcement for DeepSeek official calls
- Privacy-conscious users who want all records kept local and API keys resolved server-side only, never exposed to the browser or third parties
Related Plugins
Free web search plugin for DeepSeek Harness with web search, X search, and page fetch; no signup or API key required, with automatic multi-engine failover.

AnySearch-powered web and vertical search plugin for DeepSeek Harness, offering real-time search, cleaned URL content, concurrent batch search via native web_search/web_fetch, no API key required.
Pixel-perfect webpage clone tool that uses an agent harness to turn any webpage into a scored, full-page React replica.

A bilingual cost-tracking plugin for DeepSeek Harness with session/daily cost, budget, official & custom provider balance, coding plan quotas, peak/off-peak pricing alerts, and history stats.