dsh-shanhai-stats
Run the following command in DeepSeek Harness:
dsh plugin install cn-zhangpeng/dsh-shanhai-stats
Paste the following prompt into your AI chat to install this plugin:
Run dsh plugin install cn-zhangpeng/dsh-shanhai-stats in DeepSeek Harness to install this plugin, source: https://github.com/cn-zhangpeng/dsh-shanhai-stats
About this plugin
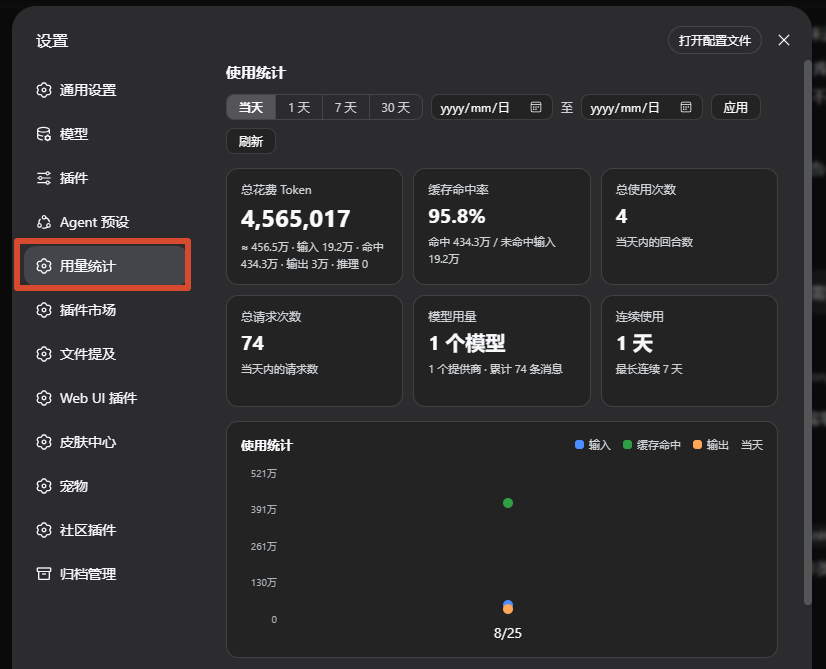
When you call multiple models through DSH every day, token spend is scattered across individual session logs. Figuring out monthly totals, cache hit rates, or which model burns the most tokens usually means digging through JSON and doing the math yourself. dsh-shanhai-stats turns that manual work into a ready-to-use usage dashboard inside DSH Settings, so your numbers are at a glance instead of buried in logs.
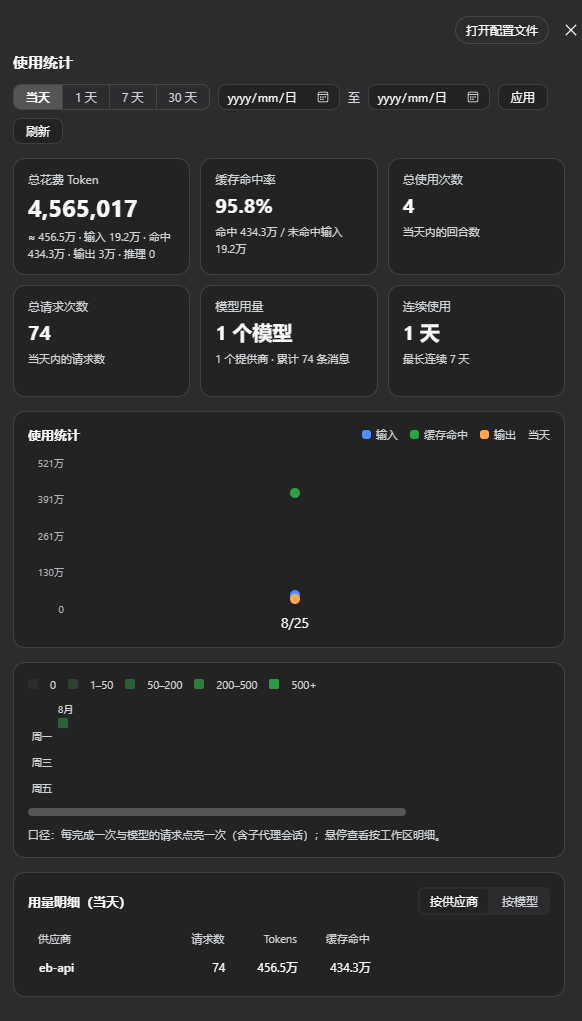
The dashboard delivers four panels: a summary badge row covering total tokens, cache hit rate, request count, and consecutive-use days; a daily four-segment token line chart (input / cache-read / cache-write / output) with toggles for today, 1-day, 7-day, and 30-day windows; a GitHub-style heatmap spanning the past 52 weeks with hover-to-reveal daily details; and a usage detail table switchable between per-provider and per-model views. All figures are aggregated directly from DSH session-log usage events, so the plugin never recalculates tokens and stays aligned with DSH's native accounting. Sub-agent sessions are included automatically, and the UI adapts to both light and dark themes out of the box.
It is built for developers who call multiple providers daily, want to track spend trends over time, gauge how well their prompt cache is working, or need a defensible basis for cost allocation across a team. Install the plugin, open Settings, and a continuously updating usage dashboard is there with zero extra configuration.
Screenshots
Use Cases
- Monitoring overall token spend trends when calling multiple LLM providers daily
- Evaluating cache hit-rate trends to refine prompting and caching strategy
- Breaking down costs by model or provider for team-level monthly reports
Best For
- Solo developers calling multiple LLM APIs at high frequency
- Tech leads who track token spend and cache efficiency over time
- Platform engineers handling LLM cost allocation and auditing for a team
Related Plugins
Free web search plugin for DeepSeek Harness with web search, X search, and page fetch; no signup or API key required, with automatic multi-engine failover.

AnySearch-powered web and vertical search plugin for DeepSeek Harness, offering real-time search, cleaned URL content, concurrent batch search via native web_search/web_fetch, no API key required.
Pixel-perfect webpage clone tool that uses an agent harness to turn any webpage into a scored, full-page React replica.

A bilingual cost-tracking plugin for DeepSeek Harness with session/daily cost, budget, official & custom provider balance, coding plan quotas, peak/off-peak pricing alerts, and history stats.